ABSTRACT
A new, continuously-monitoring portable device that monitors the diabetic foot has shown to help in reduction of diabetic foot complications. Persons affected by diabetic foot have shown to be particularly sensitive in the plantar surface; this sensitivity coupled with certain ambient conditions may cause dry skin. This dry skin leads to the formation of fissures that may eventually result in a foot ulceration and subsequent hospitalization. This new device monitors the micro-climate temperature and humidity areas between the insole and sole of the footwear.
The monitoring system consists of an array of ten sensors that take readings of relative humidity within the range of 100%±2% and temperature within the range of -40°C to 123.8 ± 0.3°C. Continuous data is collected using embedded C software and the recorded data is processed in Matlab. This allows for the display of data; the implementation of the iterative Gauss-Newton algorithm method was used to display an exponential response curve. Therefore, the aim of our system is to obtain feedback data and provide the critical information to various footwear manufacturers. The footwear manufactures will utilize this critical information to design and manufacture diabetic footwear that reduce the risk of ulcers in diabetic feet.
MATERIALS AND METHODS
System Description
The first is a portable module that allows us to gather temperature and humidity data using 10 sensors (M1). After the data is collected, a second module (M2) connects the M1 with a personal computer (PC) utilizing a Universal Serial Bus (USB) interface. The third module is the software interface module (GUI) that allows for acquisition and display of the data in text and graphics. Figure 1 depicts a block diagram of the implemented system.
Sensors 2016, 16, 1059 3 of 11 The first is a portable module that allows us to gather temperature and humidity data using 10 sensors (M1). After the data is collected, a second module (M2) connects the M1 with a personal computer (PC) utilizing a Universal Serial Bus (USB) interface. The third module is the software interface module (GUI) that allows for acquisition and display of the data in text and graphics. Figure 1 depicts a block diagram of the implemented system.
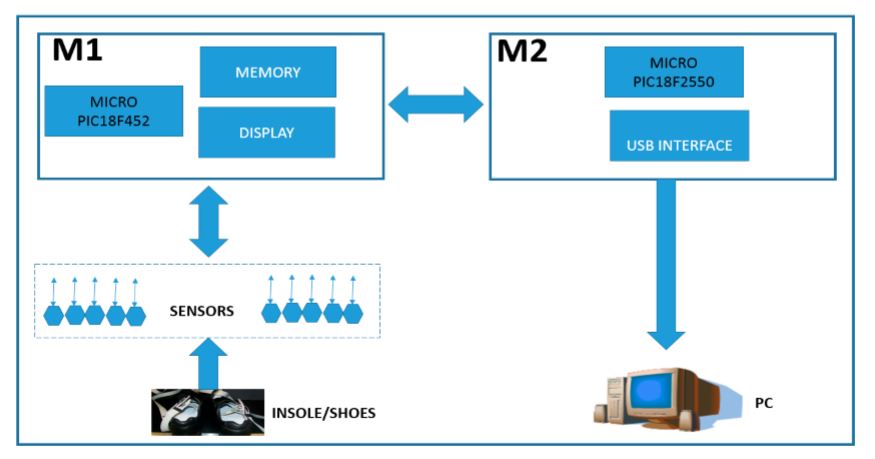
Figure 1. Block diagram of system architecture of portable system for monitoring the footwear-foot microclimate, showing the logical configuration of sensors, microprocessor, memory, USB interface, and PC
Experimental System Test
Figure 4 shows the insole with the placement of the sensors. The five sensors were placed in insoles of both the left and right footwear, with the following division of the foot: two sensors for the forefoot, two sensors for the midfoot, and one sensor for the hindfoot. In a controlled area of 23°C and 50% relative humidity, insoles were placed inside casual footwear for an acclimatization phase of 5 min. The M1 module was turned on and programmed with reading intervals of 1 min and a data collection duration of 60 min.
For the first 5 min, data was gathered from the footwear and insole configurations without feet, followed by the remaining 55 min where participants had their feet in the footwear. After 60 min, the system was turned off and the reading cycle was complete. This testing cycle was repeated five times for each individual. After each cycle, the data was downloaded by connecting M1-M2-PC and using the GUI software.
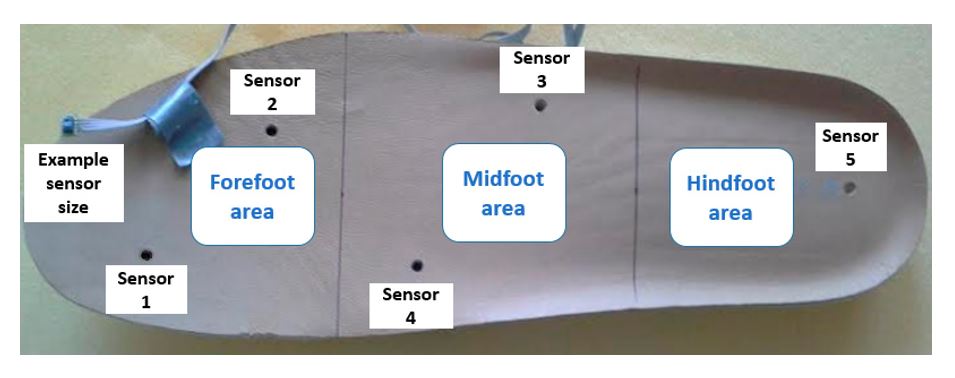
Figure 4. The five sensors were placed in insoles of both the left and right footwear, with the following division of the foot: two sensors for the forefoot, two sensors for the midfoot, and one sensor for the hindfoot.
RESULTS
Figure 5 shows the modules M1 and M2 with their physical components. The size of the M1 case was 5 cm×7 cm×3 cm, with a weight of 80 g, including the case, cables, and sensors. The flexible cables are 100 cm long with sensors included; the M1 uses an interface wire-board connector header of 20 pins with a power supply with supply voltages of 2.7 V (2.7 V to 5.5 V) and 1.8 V (1.8 V to 3.6 V). The M1 configuration has two segments with five individual sensors each, with a maximum resolution of 100% RH˘2% for relative humidity and -40 to 123.8 °C±0.3 °C for temperature.
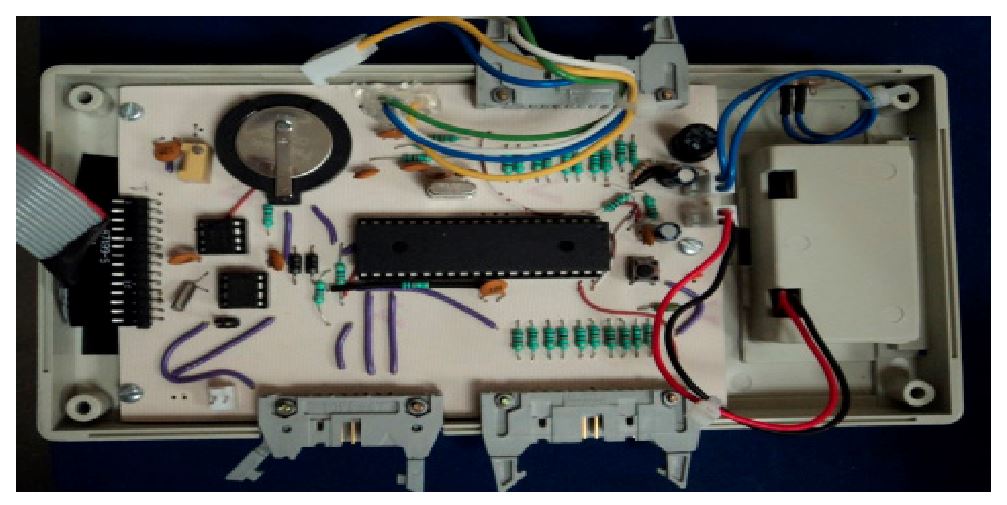
Figure 5. Electronic view of portable system for monitoring the microclimate in the footwear-foot interface
We performed system validation tests on two healthy men to demonstrate the feasibility of the system. Figure 7 shows the sensors placed in a pair of footwear, while Figure 8 shows the major components of the system placed on one of the test subjects.
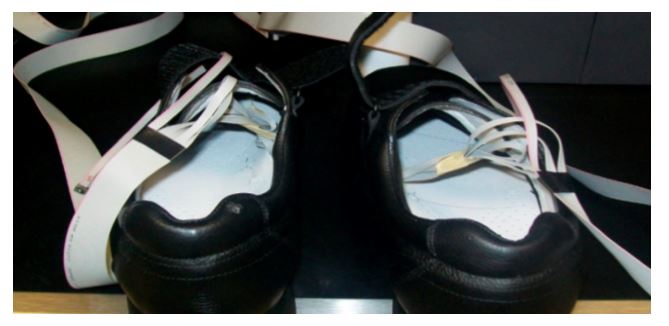
Figure 7. Array of ten sensors placed on flexible cables in the footwear
For the following data and defined ranges of interest (63.2%, 86.5%, 95%, 98.2%, and 99.3%), an exponential response curve was found, and adjustment to the resulting exponential curve was made by the nonlinear iterative Gauss-Newton method (see Figure 10).
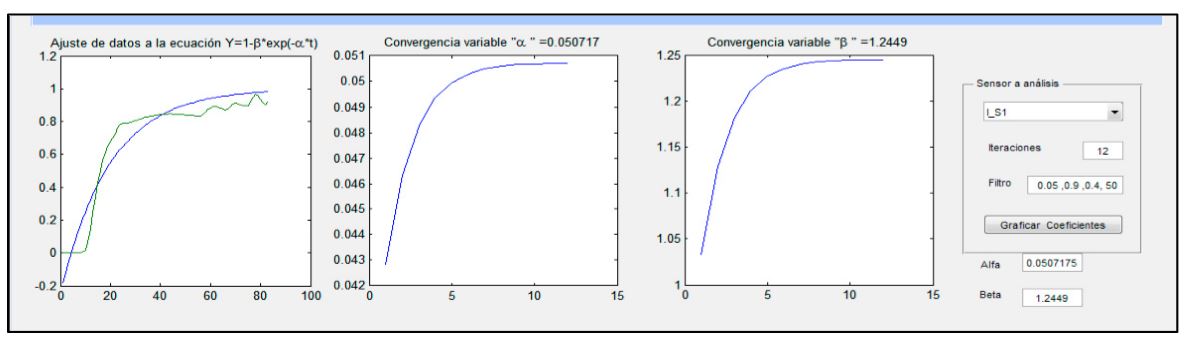
Figure 10. Software interface of to show the example of adjustment of data of temperature and humidity to the exponential curve. This adjustment was made by the nonlinear iterative Gauss-Newton Method.
DISCUSSION AND CONCLUSIONS
We provided a microclimate monitoring system with sufficient data storage of temperature and humidity readings for up to eight continuous hours at one minute intervals of portability and autonomy during data collection. The system was designed by placing the sensors in a typical division of the foot (forefoot, midfoot, and hindfoot); its design allows for their placement in other configurations as well. The results demonstrated the technical feasibility of the construction of a portable system, using commercial components at reasonable costs, designed for monitoring temperature and humidity in the footwear-foot interface.
In this paper, we conveyed testing results and implemented the iterative Gauss-Newton method to adjust the curve and show the exponential response curve graph. The results have indicated that the portable system for monitoring microclimates in the foot- footwear interface and in conjunction with the software developed in this work is a useful tool for medical applications that may help decrease or prevent the onset of diabetic ulcers and other diabetic foot complications. We are planning future work to perform studies using several types of footwear, as well as working with specific population groups that require specialized footwear, such as factory workers and patients with diabetes.
This work is limited to 60 readings of temperature and humidity, and in future studies, with different use conditions, longer readings will be considered in order to obtain a more detailed behavior of the microclimate in the footwear-foot interface. We will also consider that the monitored data from this system will help to design footwear in the future, providing information relevant to the best design shape for footwear and the materials from which they should be made, toward the end of manufacturing footwear with aggreable microclimate properties for control and prevention of ulcers.
Authors: Jose De Jesus Sandoval-palomares | Javier Yanez-mendiola | Alfonso Gomez-espinosa | Jose Martin Lopez-vela
>> 200+ Matlab Projects based on Control System for Final Year Students