ABSTRACT
In this paper a long-range wireless mesh network system is presented. It consists of three main parts: Remote Terminal Units (RTUs), Base Terminal Units (BTUs) and a Central Server (CS). The RTUs share a wireless network transmitting in the industrial, scientific and medical applications ISM band, which reaches up to 64 Km in a single point-to-point communication.
A BTU controls the traffic within the network and has as its main task interconnecting it to a Ku-band satellite link using an embedded microcontroller-based gateway. Collected data is stored in a CS and presented to the final user in a numerical and a graphical form in a web portal.
GENERAL OVERVIEW OF THE SYSTEM
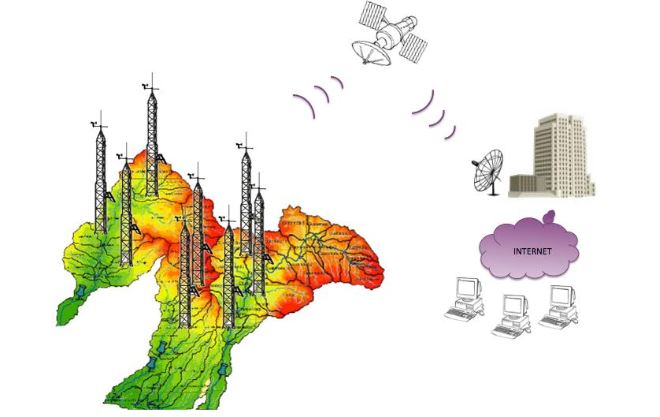
Figure 1. General overview of the proposed system, on the left side the ISM network
The BTU has the task to address the requests from the RMS to the corresponding RTU and to send back the data collected by them. This information is sent with intervals of 10 min through a satellite link in the Ku-band. Data sent by the BTUs is stored in the CS where historical data is generated and presented to the final user in a portal web in Graphic User Interface (GUI). Figure 1 illustrates a general overview of the system.
REMOTE TERMINAL UNIT (RTU)
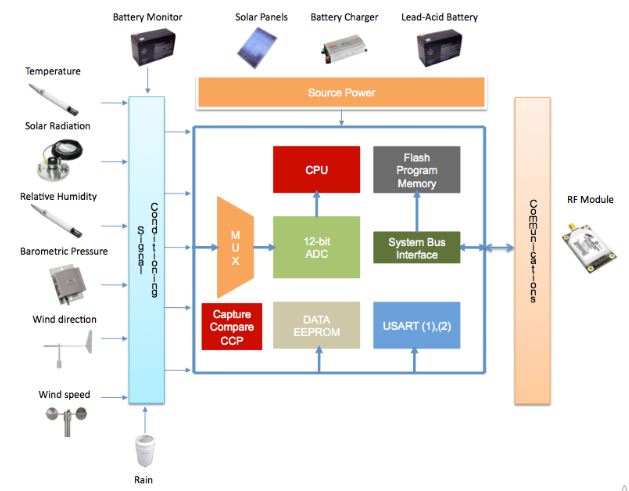
Figure 2 . Block diagram of the main modules of the Remote Terminal Unit
Rotation of the cup wheel opens and closes a reed switch at a rate proportional to wind speed. The maximum frequency that the MCU can measure is 74.76 Hz or, in terms of speed, the range varies from 0 to 49 ms−1. In Figure 2 a block diagram of the main components of the APM are depicted as well as the source power and communication modules, which will be explained in the next section.
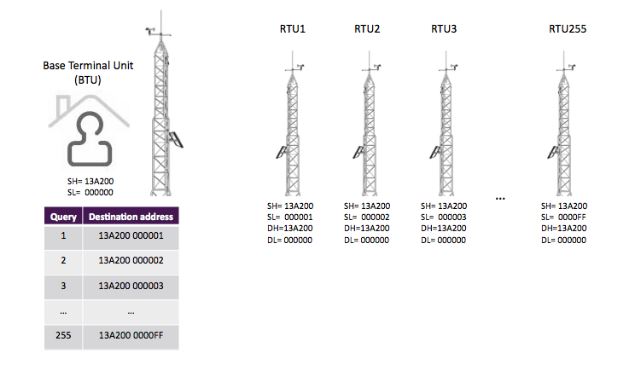
Figure 3. Example of destination and source parameters in wireless communication between remote and base units
Making an analogy to a telephone system, the destination number (DH-DL) that the RTUs have to “dial” is the BTU’s unique serial number (SH-SL). On the other hand, to communicate the BTU with each one of the RTUs, it will be necessary to “dial” the unique serial number (SH-SL) of each one of the RTUs. This address relationship is shown in Figure 3.
REMOTE BASE UNIT
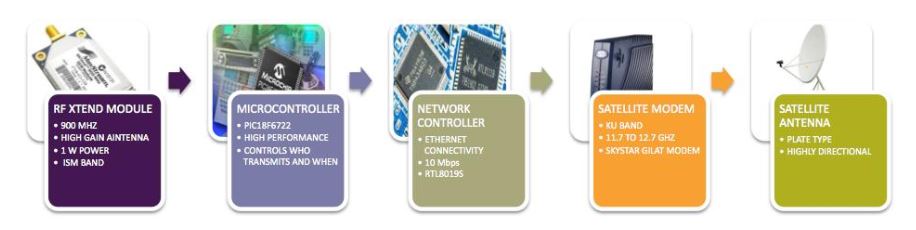
Figure 5. Main components of the Remote Base Unit
Thus, the RBU acts as an entry/exit point to the network, in other words, joins together two networks that use different base protocols, in one side a WSN (the one constituted by the RTUs) transmitting in a 900 MHz frequency using the band ISM (intended for Industrial, Scientific and Medical applications) and on the other side the a WAN interconnected by satellite networks. In Figure 5, the main blocks of a Remote Base Unit are illustrated.
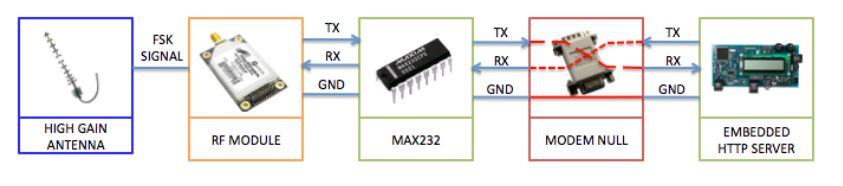
Figure 7. Connections between the Embedded HTTP Server and the RF Module
The HTTP server includes a RS232 port, which allows communication between the PIC18F6722 and the RF module. Necessary hardware to connect both devices includes an integrated circuit MAX232 (for converting RS232 to USART protocol) and a modem-null module (wired to interconnect transmission Tx with reception terminals Rx and viceverza). The connections’ diagram is shown in Figure 7.
CENTRAL SERVER (CS)
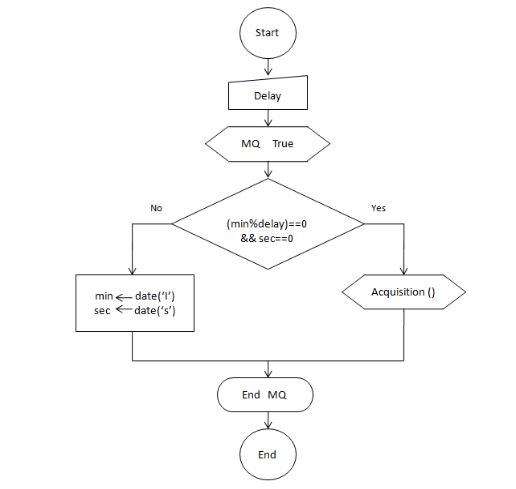
Figure 11. Flow diagram for the data transmission request in the central server
An information request is sent to the BTU by using the “get” method, which tracks keywords or symbols along the embedded webpage in the BTU. For example to read the relative humidity in a base terminal unit, the “get” command “sweeps” the webpage content and looks for the words “Relative” plus “blank space” plus “Humidity”. After that, the number that follows the keywords is read. The flow diagram of the requests generated by the CS is shown in Figure 11.
SYSTEM TESTING AND RESULTS
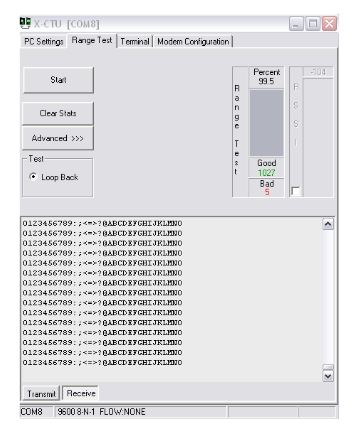
Figure 13. Range test with the X-CTU software
The LOS analysis was performed by using the X-CT U software from Digi. Data packets sent consisted of a sequence of alphanumerical characters, as shown in Figure 13, and transmitted at a rate of 9, 600 bps. The results of the range test showed a 99.5% of reliability, which in other words means that for 1, 000 transmitted packets, only five were received incorrectly.
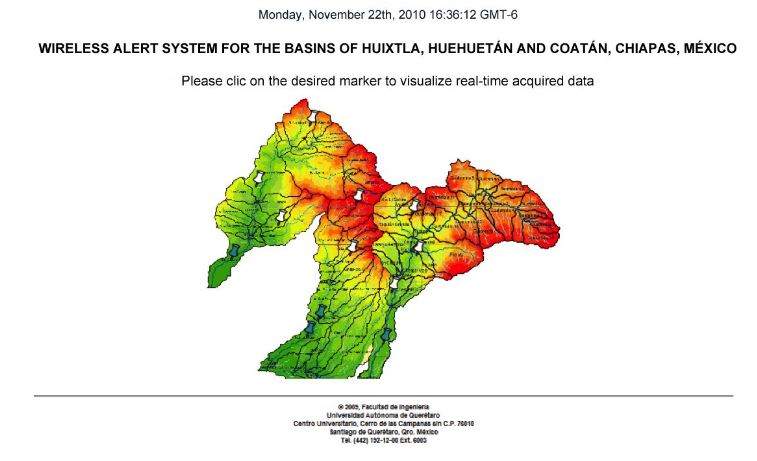
Figure 15. Main screen of the web portal which shows the location of the RTUs in the geographic region
The main screen of the web portal is shown in Figure 15, where the RTU’s location map can be appreciated in the center. The specific location of each one of the RTUs is divided between three wireless stations networks. One is located in the upper left of the map and constituted by the EMA Cerrodelas Cruces, EMA Fincala Victoria and EMA Agua Prieta.
PERFORMANCE OF THE WLAN
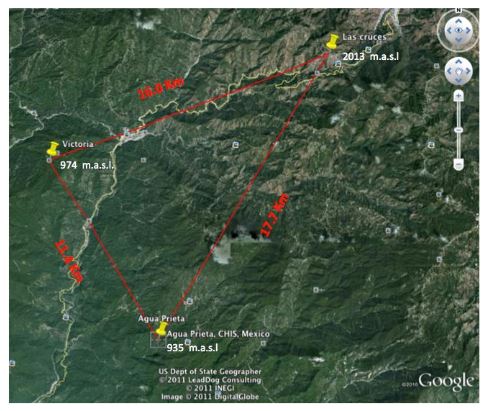
Figure 20. Distances measured between RTUs and BTU in Huixtla’s basin
Because of the geography of the zone and as a result of a Line of Sight (LOS) analysis, the WLAN was divided into three different zones, “Huixtla”, “Coatán” and “Huehuetán”. To exemplify the performance of the network, the distribution of the Huixtla zone is shown in Figure 20.
CONCLUSIONS
A long-range remote monitoring system constituted by three parts: Remote Terminal Units (BTUs), Base Terminal Units (BTUs) and a Central Server (CS) has been developed. Field tests have shown a high reliability (97%) of the satellite network data transmission and in the LOS analysis in the 900 MHz wireless networks it was 99.8%. The WSN currently implemented in the region “Los Altos de Chiapas” reduces the need of satellite links for each RTU due to the use of 900 MHz RF transmitters in the ISM band intended for Industrial, Scientific and Medical applications and as a consequence the implementation cost is minimized.
Although the monitoring system is currently focused on the measurement and transmission of climatologic variables, it is designed following the principle of modularity, so it is possible to change the network sensors and apply it in multiple applications in the industrial, scientific and medical sectors and generally speaking in any application where the remote monitoring represents some danger, or could be inaccessible or economically non-viable for the user.
Source: Autonomus University
Authors: Manuel Toledano-Ayala | Gilberto Herrera-Ruiz | Genaro M. Soto-Zarazúa | Edgar A. Rivas-Araiza | Rey D. Bazan Trujillo | Rafael E. Porras-Trejo
>> More Wireless Sensor Networks Projects Abstract for Engineering Students
>> More Wireless Embedded Projects for Final Year Students
>> More Wireless Projects Using Microcontroller for Final Year Students