ABSTRACT
Personal computing devices have gone through more than four decades of evolution. The form factor of computing devices has gone down dramatically, while computation workload for each computing device has increased significantly. Moreover, people spend much more time interacting with computing devices than before. In short, everyone has a pocket supercomputer.
Delivery of intelligent services today is only possible thanks to rich context information from wearable devices, an emerging personal computing platform. Power efficiency is one of the determinant factors for the adoption rate of wearable devices, as people expect it to work 24/7.
Most existing works often pay careful attention to the energy and processing cost from the component level and show significant power efficiency gain by utilizing device level power management. Even with an abundance of such work, power optimization on wearable devices remains as an open problem, and available solutions only manage to provide weeks of continuous user experience before a battery recharge. To this end, this dissertation systematically measures and quantifies power characteristics of a wearable computing system, then explores adaptive approaches to best balance power consumption and user experience.
A methodological application agnostic, yet practical, power optimization framework built upon adaptive sensing and communication management, is proposed and tested in several research projects. On top of that, we propose Gazelle, a personalized running analysis wearable system. Gazelle has been tested in the real world on more than fifty users over a year. It provides one order of magnitude better battery life comparing to other commercialized wearable platforms. The methodology and proposed framework can be readily extended to other application dependent wearable computing platforms.
RELATED WORK
Personalized Service Delivered from Mobile Sensing System
Sensing systems that utilize mobile platform and other devices such as GPS, accelerometer, and OBD device, have been developed for monitoring road and traffic conditions, commute time, WiFi deployment, and automotive diagnostics, or finding the optimal route in terms of lowest fuel consumption. These systems require purchasing extra devices, which limits user adoption.
Privacy of driving trips has also been studied. Several techniques have been proposed to classify a wide variety of human movements and activities using mobile device. However, previous works typically require stable sensor placement for data collection, e.g., mounting the phone in a fixed place. Such requirement is intrusive and inconvenient for users. During a driving trip, the phone may move relative to the vehicle (e.g., sliding or user picking up a phone call). Such abnormal movements make statistical models inadequate and affect the quality of monitored data. This may be addressed by taking extraneous activities into consideration.
DBMA: PERSONALIZED DRIVING BEHAVIOR MONITORING AND ANALYSIS FOR EMERGING HYBRID VEHICLES
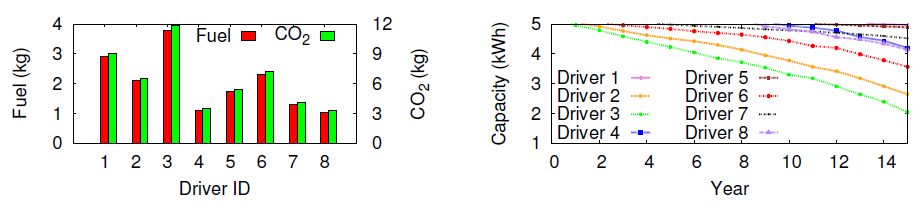
Figure 3.1: Heterogeneous fuel use, CO2 emissions, and battery system long-term capacity degradation based on eight different users daily commute driving profiles.
Figure 3.1 shows the fuel use, CO2 emissions, and battery system long-term capacity degradation based on eight different users’ daily commute driving profiles. Among the eight drivers, over 3x variation is observed in terms of fuel use and CO2 emissions for battery system, and based on the system-level battery model developed by Li et al, over 9x long-term capacity variation can be expected.
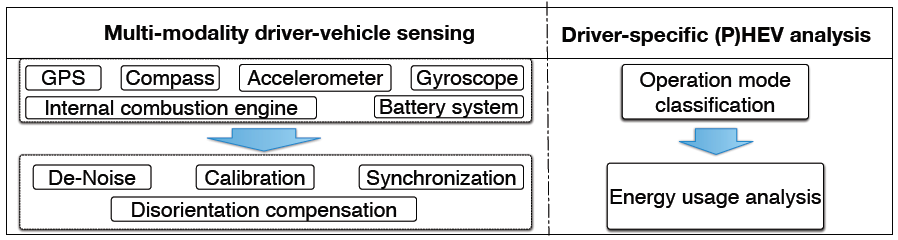
Figure 3.2: Personalized driving behavior monitoring and analysis for emerging (P)HEVs.
Accurate characterization and quantification of the relationships between user-specific driving behavior and (P) HEV energy and environmental impacts require fine-grained, time-stamped, robust sensor readings during users’ driving trips, as well as accurate modeling of (P) HEV internal operation mechanisms. We propose a two-staged process, as illustrated in figure 3.2.
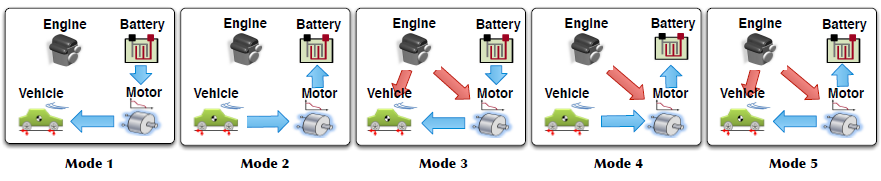
Figure 3.11: Categorization of (P)HEV operation modes under different driving scenarios.
Modeling (P)HEV energy use is a difficult task. On one hand, users’ driving behaviors are diverse and vary by road and traffic conditions. On the other hand, under different conditions, a (P)HEV may be powered by either battery or fuel, or both, each of which is a complex process. To address these issues, we have identified five operation modes for the Toyota Prius control system, based on the operation animation displayed on dashboard. The modes are illustrated in figure 3.11.
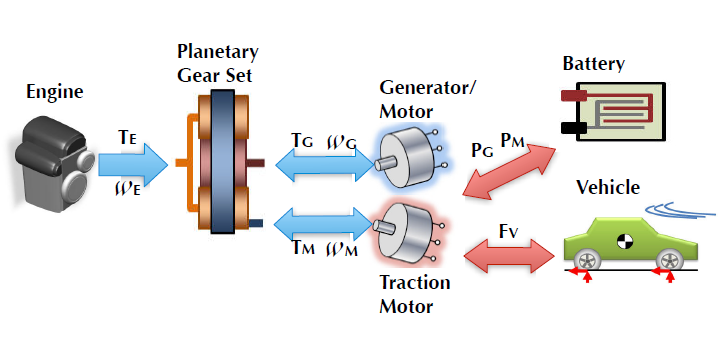
Figure 3.12: (P)HEV energy profile analysis. Engine and battery system work together to balance the power demand of the vehicle.
Based on the different operation modes, we develop an analytical (P)HEV model specifically for Toyota Prius in MATLAB. Prius adopts series-parallel structure in its drive-train, where the engine, generator/motor and traction motor are coupled together through the planetary gear set to provide the demanded traction power. The driving power requirement is distributed between the Motor and ICE depending on the different modes and user-specific driving behavior. This procedure is illustrated in figure 3.12.
ISCOPE: PERSONALIZED MULTI-MODALITY IMAGE MANAGEMENT AND SEARCH FOR MOBILE DEVICES
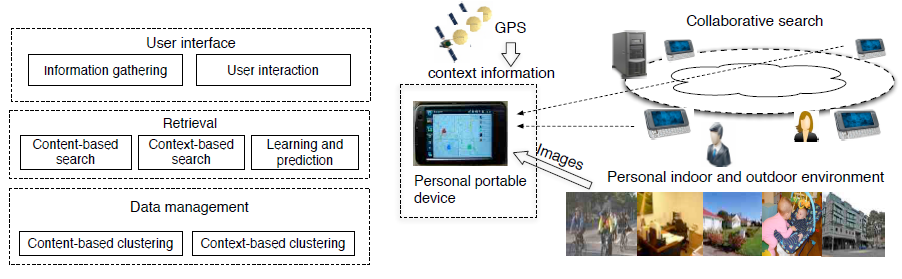
Figure 4.1: System architecture overview of iScope: Personalized multi-modality image search for mobile devices.
In this chapter, we describe iScope, a personal content management platform. iScope is a user-centric design targeting energy-constrained distributed mobile environments. It leverages both personal context information and efficient content search techniques, as well as online learning techniques, to deliver personalized, energy-efficient content search services.
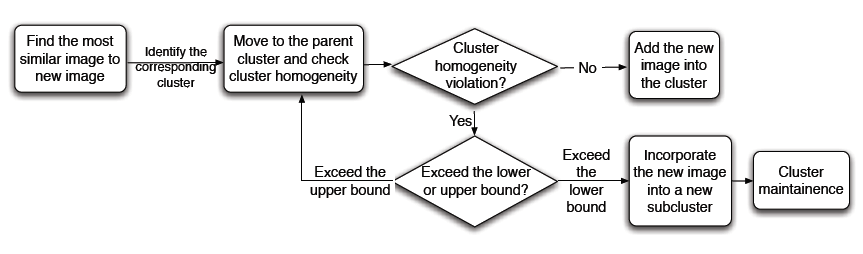
Figure 4.3: Incremental hierarchical clustering: Flow chart shows the key steps when a new image is inserted.
In iScope, the clustering operation can be divided into two major procedures: tree construction and tree maintenance. Figure 4.3 illustrates the key steps when a new image is added. In the tree construction stage, the new image is added into the clustering hierarchy in a bottom-up fashion. Our algorithm first finds the nearest (most similar) image at the bottom level and recursively checks if the parent cluster can host the new image with minimal density changes and minimal disruption to the hierarchy monotonicity.
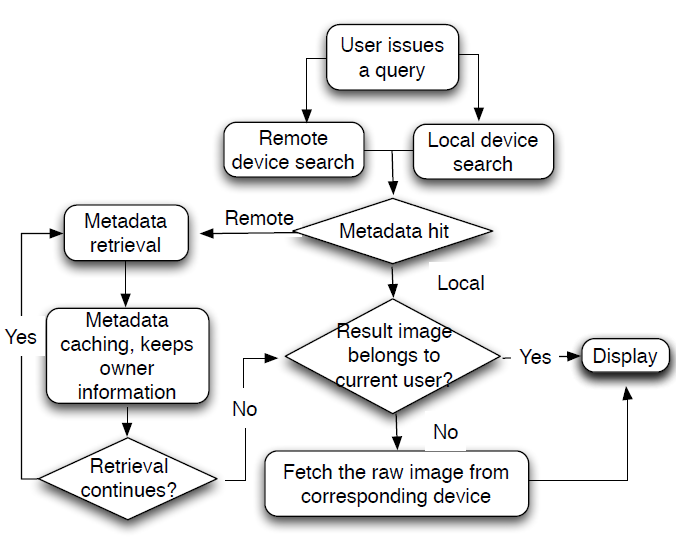
Figure 4.7: Collaborative search flow chart.
In the meantime, the query is broadcasted to other devices within the social group. Each remote device will collaboratively conduct local search within its shared data set and return the results, e.g., metadata and/or the raw images, back to the querying device. The user interface for distributed search is identical to that of local search; the remote search process is transparent to the end user. Figure 4.7 demonstrates the ow of collaborative search.
MAQS: A PERSONALIZED MOBILE SENSING SYSTEM FOR INDOOR AIR QUALITY MONITORING
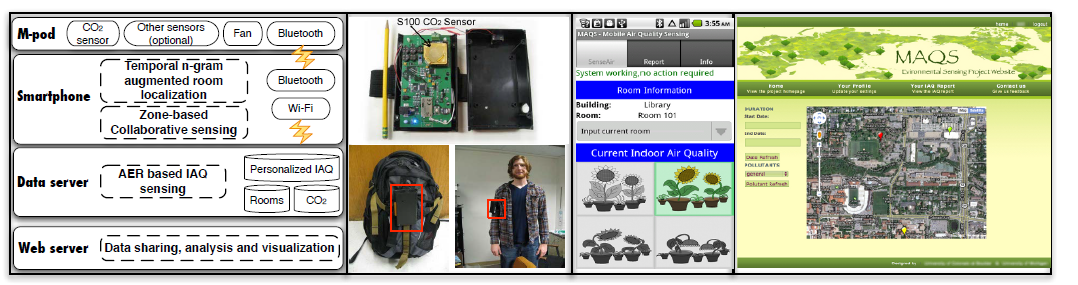
Figure 5.1: MAQS: A mobile sensing system for personalized indoor air quality (IAQ) monitoring.
As illustrated in figure 5.1, MAQS consists of four types of components: (1) M-pods, the portable IAQ sensing devices; (2) smartphones; (3) a data server; and (4) a web server. MAQS users carry smartphones and optionally M-pods. The data server communicates with clients and maintains room air quality, CO2, and personalized IAQ data. The web sever allows users to view, analyze, and share IAQ data. There are three main functional units in MAQS: (a) temporal ngram augmented room localization, (b) air exchange rate based IAQ sensing, and (c) zone-based collaborative sensing.
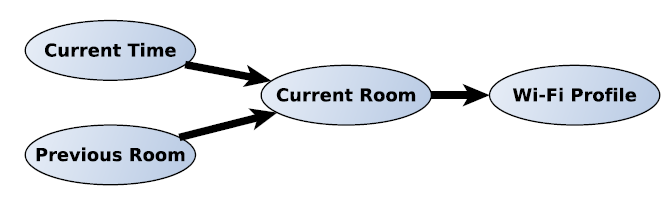
Figure 5.3: bayesian network for room localization.
As shown in figure 5.3, the bayesian network has three layers: current time and user’s previous room (first layer) indicate the user’s current room (second layer), and user’s current room determines the observed wi-fi rss fingerprint. we also define a set of values to represent some semantic concepts of time, including “day of week”, “morning”, “afternoon”, and “evening”.
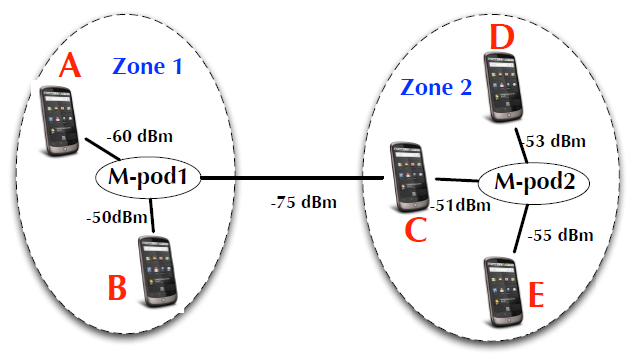
Figure 5.8: Zone-based collaborative sensing.
5.8 illustrates the concept of zone-based information sharing. Numbers along the lines indicate the RSSI between phone and M-pod. In this scenario, phones A and B belong to the zone occupied by M-pod S1, because they are within the required range of S1. Since the RSSI between phone C and M-pod S1 is lower than the threshold, they belong to different zones.
GAZELLE: WEARABLE SENSING AND ANALYSIS FOR FITNESS AND HEALTH
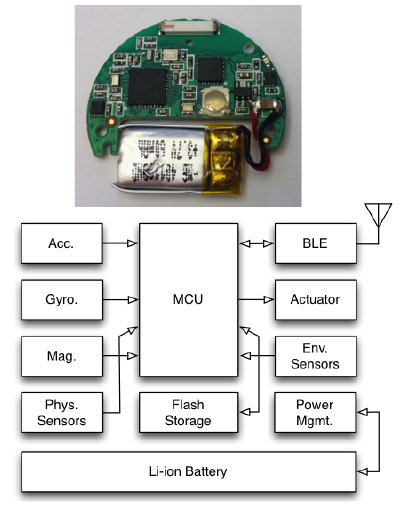
Figure 6.1: System overview of Gazelle. A photo of the PCB and battery(top), and system-level architecture (bottom).
Figure 6.1 shows a photo and the system architecture of Gazelle which, when worn on the ankle or in the shoe, senses and computes the wearer’s running performance in order to record training histories and to provide feedback in the form of coaching suggestions. The device detects and logs information about a range of regularized movements.
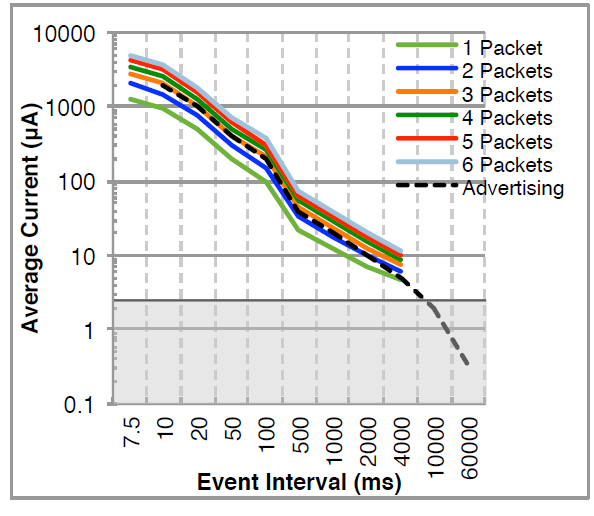
Figure 6.4: Average currents of the supported intervals Bluetooth LE connections and advertising events.
Figure 6.4: Average currents of the supported intervals Bluetooth LE connections and advertising events. Connection events using from 1 to 6 packets per event are shown. Advertising intervals up to 10 seconds are shown, although advertising may not be periodic. Grey area indicates background current required to keep a connection active.
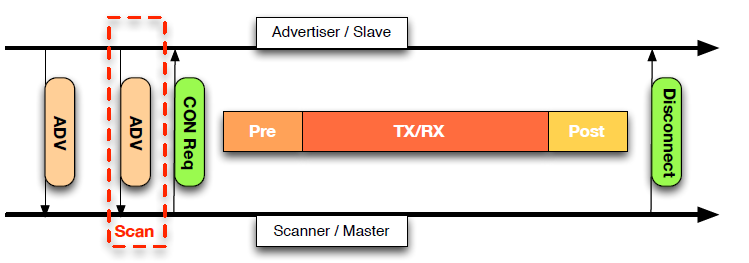
Figure 6.10: Master request to end the connection.
Figure 6.10 demonstrates an example of a normal BLE communication procedure. A BLE communication happens between one master and multiple slaves. In the beginning, the slave would keep on broadcasting the advertisement packets to announce its existence. Once one of the packet is caught by master, master initialize the request to connect, and if the consent from slave is obtained, a communication is established.
LAST THOUGHTS
Conclusion
Wearable computing systems are a quickly emerging personal computing platform. They consist of one or more wearable devices serving as sensing terminals, a mobile phone serving as a sensing and information sharing hub, and cloud infrastructure for intensive analysis work. These systems will eventually deliver personalized and intelligent service to the user.
This thesis primarily focuses on two aspects of power optimization for wearable computing systems. 1) methodological quantification of power efficiency challenge, and 2) systematic approaches to address it by leveraging context information in an application agnostic, yet practical manner. Power consumption breakdown analysis is done on both components and system level, and an adaptive sensing and communication framework is applied to different applications to verify the improvement of power efficiency. The proposed approach has been tested and used in a real world user study deployment. The methodology of this thesis can be readily applied to other forms of wearable computing platform.
This thesis makes the following contributions:
- Based on a comprehensive analysis of the power consumption in a wearable computing system, it is demonstrated that in wearable application, battery life time and good user experience is tightly coupled; improve one part and the other is naturally improved. On the other hand, power consumption is no longer dominated by computational workload. 108 Rather, components for user interaction and data communication contribute equally to energy expenditure.
- It is shown that there is significant room for improvement in wearable computing system power efficiency. The standard battery life expectation for current wearable computers is measured in days. However, by leveraging the rich context information and unique characteristics of usage pattern of wearables, an adaptive sensing and communication framework is proposed, which makes it possible to prolong battery life of wearable computing system to be in the scale of months or even years
Future Work
For immediate future research directions, the following extensions of this work can be considered: First, the proposed connection-less communication can be expanded into full duplex working mode. Currently, because of the single direction information transmission, the usage scenario of connection-less communication is severely limited, and the whole system is benefited only when context information is transmitted from the wearable device to the mobile phone. If bidirectional mode is developed, it will open the path for numerous context aware power optimization for wearable applications, as long as most of the context information exchange happens in the form of shortamount, bursting, or one to many communication, which will likely to be the case for lots of applications.
Source: University of Colorado
Authors: Kun Li
>> 200+ Matlab Projects based on Control System for Final Year Students