ABSTRACT
The project is given as a proposal for increasing the safety of cyclists riding on the country roads. It can be sometimes hazardous for bike riders to ride either on the same road with the cars or on the suburban road. Thus, an alerting system which will be mounted on the bicycle is required.
The aim of the project is to find most suitable sensor which can generate the alert early enough that cyclist can take an action before the vehicle reaches up. Since the sensor will be used for bicycles, power consumption and the size of the sensor should be rather small.
Audio detection was chosen from among all the possible detection types. In order to distinguish the sound from an approaching vehicle among all environmental noises, many samples were collected and analysed. Classifying and comparing the sounds; the most interesting features of the vehicle approaches were found out as; frequency shifts and amplitude increment in power spectrum, regularity/irregularity changes within the sound, mass point shifts and loudness level increment.
Four different methods were used regarding correlations. Samples were filtered to obtain better results. Considering all the cases, there is a threshold was set for all methods in order not to confuse them with environmental noises or riskless cases. Specifying a threshold value has also its disadvantages, because making alert generation more reliable is inversely proportional with success ratio. The most of the methods given in this report have the approximate success ratio of % 70.
Having approximately %70 of success ratio for each method is quite sufficient, considering those methods can be fused together to have more accurate sensor.
My work is a proof that many different types of sound correlations can be used to determine if there is a vehicle approaching or not. Methods that pointed out in this report can be used to build up a fine alerting system to increase the awareness of cyclists.
BACKGROUND
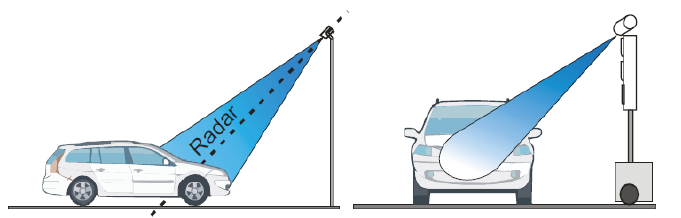
Figure 2-1: Representative Figure of Doppler Radar Application
Doppler radar detector is a specialized radar type that was created by using frequency shifts. Doppler radar transmits microwave beams with a certain frequency and receives reflected waves. Sent beams are shifted by hitting a moving vehicle and it is possible to calculate target’s speed, approaching direction and road lane using this alteration, though using this method without having proper configurations is generally erroneous. The aim of these configurations is to alter the properties of the radar to have the best result.
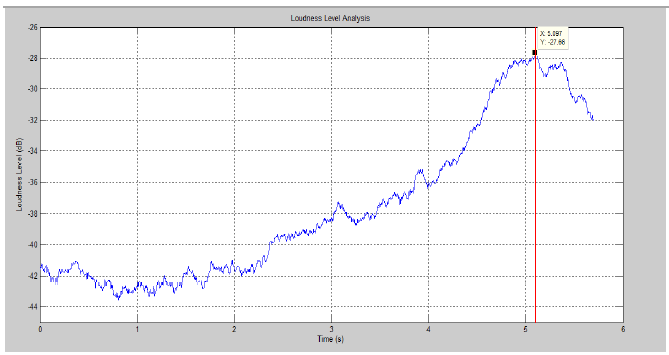
Figure 2-5: Root Mean Square Amplitude Variation vs. Time of an Approaching Vehicle
Figure 2-5 belongs to a sound sample of an approaching vehicle. Red line indicates the moment where the vehicle catches up the cyclist which is at 5.097th second for this case. The threshold value is not the RMS value itself but a comparison of present value with the previous values. In other words, having an increment, for example, from -30 dB to – 25 dB will generate an alert.
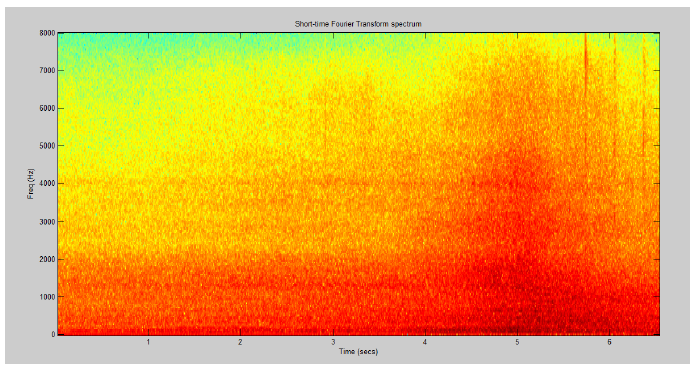
Figure 2-10: Frequency Energy Spectrum Variation vs. Time of Vehicle Approaching Sound Sample
Figure 2-10 belongs to a case where the vehicle reaches up at 5th second. This graph is summarizing the aim of the analysis given in this section. As it can be obviously seen from the graph, radiated energy is greatly increasing as the vehicle closes up. This energy increment reveals itself in amplitude increment which is useful for detection.
METHODS
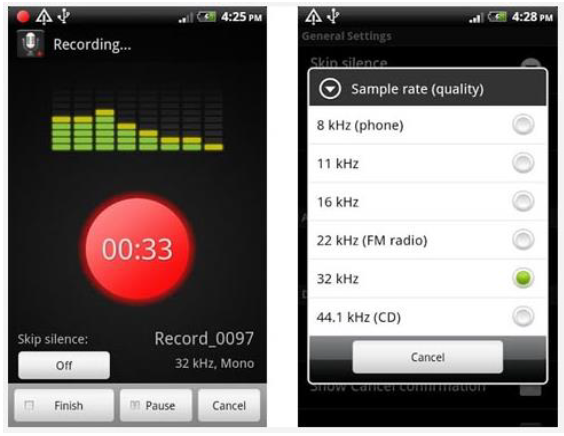
Figure 3-1: Smart Voice Recorder Interface
Smart voice recorder was chosen among similar android applications. One of the main reasons to choose this application is its simplicity. Smart voice recorder also visualise some technical properties and allows controlling them, such as sampling frequency. Sampling frequency is one of the main properties that is necessary for this project to be known.
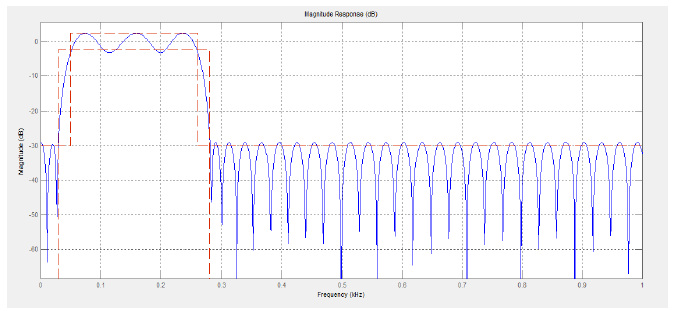
Figure 3-2: Magnitude Response of Designed Band-pass Filter
Figure 3-2 was plotted to visualize the filter designed for the project. As it can be clearly seen from the graph, uninteresting frequencies were damped. Only important frequency band is kept so that unwanted confusions can be avoided.
RESULTS
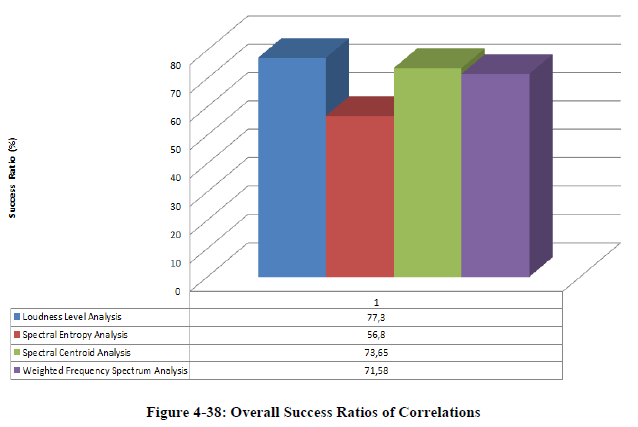
Figure 4-38: Overall Success Ratios of Correlations
As it can be seen in the Figure 4-38, the best two results revealed to be Loudness Level Analysis and Spectral Centroid Analysis. As it is mentioned previously, the cases are going to be analysed based on individual sound samples. The samples are analysed once more using new logical diagrams and the success ratios are re-calculated. There are two different fusion is going to be used for the detection as; parallel connection and serial connection. The purpose of doing two different fusions is to justify the selection of the fusion.
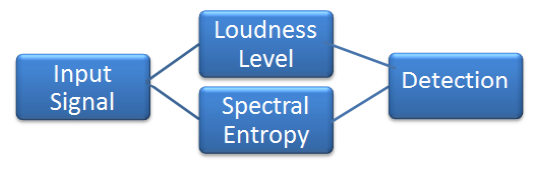
Figure 4-39: Parallel Fusion Diagram
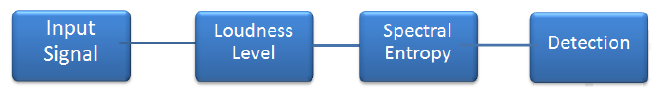
Figure4-40: Serial Fusion Diagram
After re-organizing the samples using the given logical diagrams above, the results are obtained for both serial and parallel fusion. The success ratio for each type of vehicle and the weighted mean of the overall success ratio is re-calculated. As it was mentioned before, successful cases are the detections which are real alerts and generated at the latest 1.5 seconds before vehicle catches up the cyclist. The results are as follow;
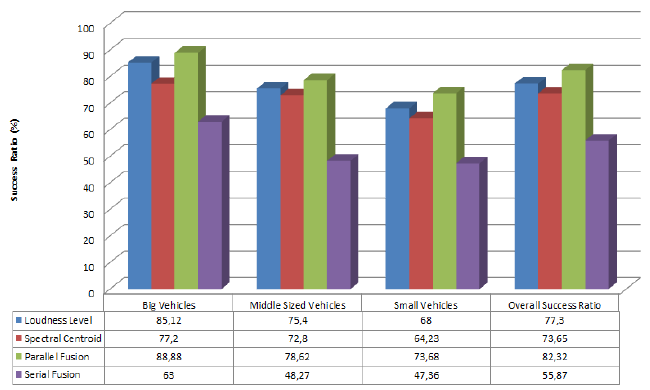
Figure 4-41: Success Ratio versus Detection Type Graph
Figure 4-41 summarizes the sensor fusion and resultant success ratios. First of all, the correlations’ own success ratios depending on vehicle sizes are shown in the table on the graph. Afterwards, the resultant success ratios of fusion types are also presented.
DISCUSSIONS AND CONCLUSIONS
In this chapter I am going to talk about the conclusions of my work. I am also going to give some advices about how the similar works can be enhanced.
My purpose was to find the suitable sensor for the cyclists that can detect dangerously rear approaching vehicles early enough to make it possible for cyclists to have enough time to take an action as long as possible. I have chosen microphone for this type of detection. Microphone meets the requirements by the means of power consumption and size.
I found some correlations that I can use for my project. I have created the scenarios and collected the data. I have used Matlab for executing the analysis. My first goal was to be able to identify approaching vehicle sound among all the possible noises. After using many correlations I have achieved my goal, though there was a deceptive point in executing sound detection. The microphone should not be emposed by any other mechanical impacts such as wind. If the microphone is not immune against wind, the collected data is more likely to be altered. These alterations may be so strong that they may lead to unreal alerts.
After this stage, I have focused on how to execute detection early enough.The range is wanted to be around 100 meters as I started the project but I have ended up with the approximate range of 30 meters. After making many experiments with the captured sound sample, I have found out that the time is more important than the range. The speed and the sound strength of the approaching vehicle was determinant on the range. Fast approaching vehicles could be detected within a longer range, though slower vehicles could be detected in a rather short range.
This is because of frequency changes and the sound patterns that vehicles create on the road and in the environment is more intense for faster and bigger vehicles. Slower vehicles create weaker frequency indicators comparing to faster vehicles. Since most of the correlations I am using are related with the frequency indicators, vehicles creating stronger frequency changes can be detected easier. The thing I am trying to point out is that it is easier to say how early can the vehicle be detected than the distance. This time value for my project is settled to be 1.5 seconds at the latest.
Source: Halmstad University
Author: Ahmet Tansu Bakkal
>> Top 30+ Electrical Mini Projects for 3rd Year B.E/B.Tech Students
>> Automobile based Matlab Project Topics with Free Base Papers Downloads
>> Matlab Projects Fingerprint Recognition and Face detection for Engineering Students
>> 200+ Matlab Projects based on Control System for Final Year Students