ABSTRACT
An ECG (electrocardiogram) simulator is an electronic tool that plays an essential role in the testing, design, and development of ECG monitors and other ECG equipment. Principally an ECG simulator provides ECG monitors with an electrical signal that emulates the human heart’s electrical signal so that the monitor can be tested for reliability and important diagnostic capabilities.
However, the current portable commercially available ECG simulators are lacking in their ability to fully test ECG monitors. Specifically, the portable simulators presently on the market do not produce authentic ECG signals but rather they endeavor to create the ECG signals mathematically. They even attempt to mathematically create arrhythmias (irregular heartbeats of which there are many different types).
Arrhythmia detection is an important capability for any modern ECG monitor because arrhythmias are often the critical link to the diagnosis of heart conditions or cardiovascular disease. The focus of this thesis is the design and implementation of a portable ECG simulator. The important innovation of this prototype simulator is that it will not create its ECG signals mathematically, but rather it will store ECG data files on a memory module and use this data to produce an authentic ECG signal.
The data files will consist of different types of ECG signals including different types of arrhythmias. The data files are obtain ed via the internet and require formatting and storing onto a memory chip. These files are then processed by a digital to analog converter and output on a four lead network to produce an authentic ECG signal. The system is built around the ultra-low power Texas Instruments MSP430 microcontroller.
ECG MONITORS FUNCTIONALITY
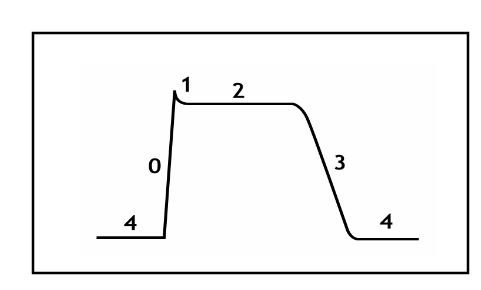
Figure 3 Cardiac Action Potential
The action potential has 5 phases (numbered 0-4)). These phases directly correspond to segments of the ECG wave observed on an ECG monitor. The ECG wave segments (Q, R, S, P, T) will be explained in detail in the section titled “ECG Waveform Segments” below. Starting at the far left of Figure 3, phase 4 is the resting membrane potential, and describes the membrane potential when the cell is not being stimulated (-50 to -100 mV).
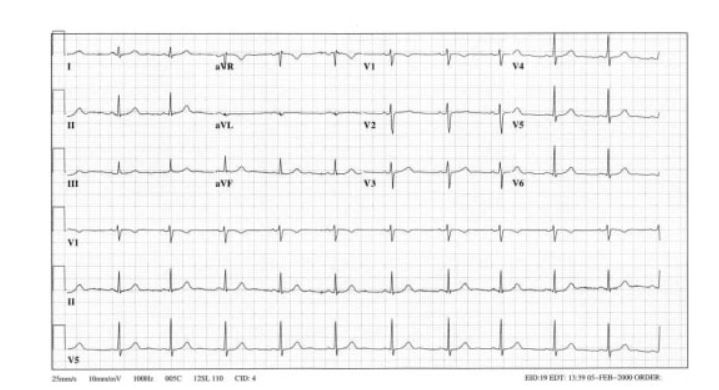
Figure 5 Actual Electrocardiogram output
Just one heart cycle is not enough to shed light on the condition of the heart; the electrocardiogram is a series of heartbeat signals that are analyzed as a whole. Figure 5 illustrates an actual electrocardiog ram output (see Appendix for permission to use images). The electrocardiogram is an important part of the initial evaluation of a patient who is suspected to have any heart related problem. The ECG is an extremely safe non-invasive test and there is no risk involved.
PROVIDING AUTHENTIC HEART SIGNALS
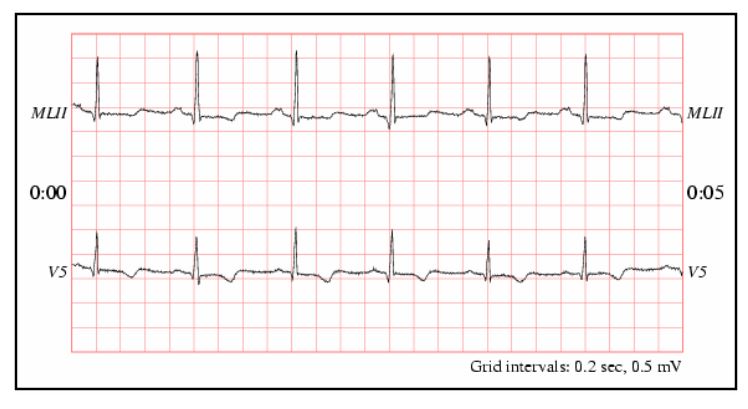
Figure 9 Example of Chart-O-Matic ECG signal
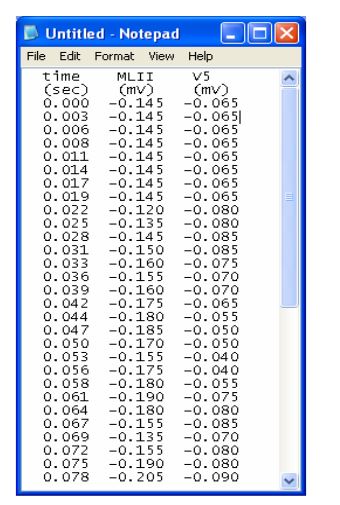
Figure 10 Example of ECG Data from PhysioNet’s Chart-O-Matic
Figure 9 shows what a “Chart-O-Matic” electrocardiogram looks like. In addition to the chart of the signal, one can also obtain one minute’s worth of the data from the record. This is precisely what is needed for the project at hand. The data files can be viewed by clicking “Convert signals to text.” An example of a MIT-BIH ECG signal file is shown in Figure 10; this is the data corresponding to the plot shown in Figure 9 (see Appendix for permission to use images).
SYSTEM HARDWARE COMPONENTS
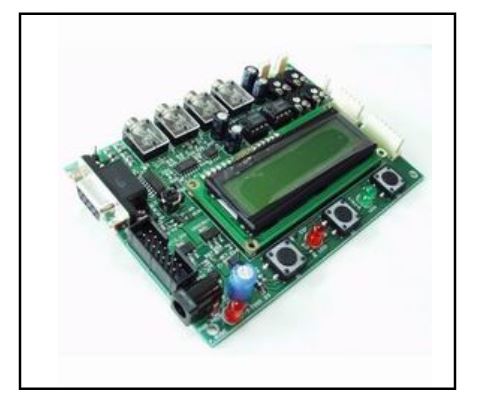
Figure 13 Olimex Development Board
The location of the Olimex Company is not provided on there web site and they did not respond to several emails. A picture of the development board is shown in Figure 13 (see Appendix for permission to use images). The biggest drawback of the board was the fact that almost no documentation is available for the board.
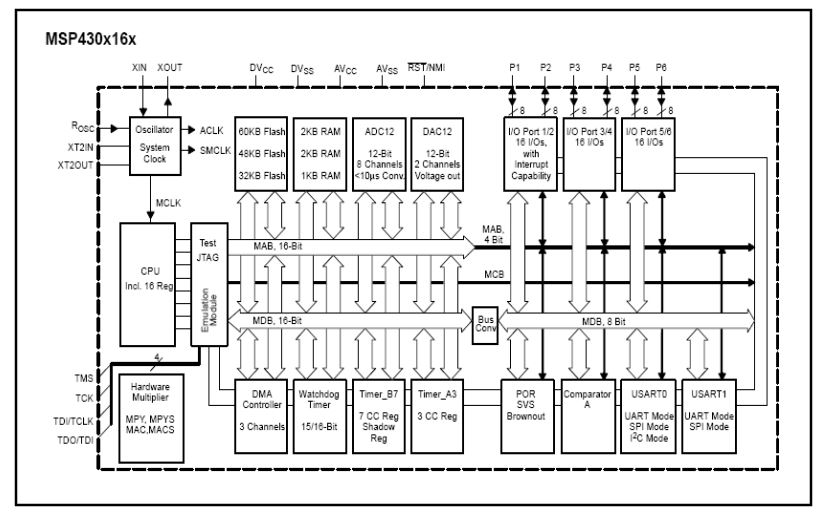
Figure 15 TI MSP430-F169 High Level Block Diagram
The F169 series is configured with two built-in 16-bit timers, a fast 12-bit A/D converter, dual 12-bit D/A converters, one or two universal serial synchronous/asynchronous communication interfaces (USART), I2C, DMA, and 48 I/O pins. The block diagram of the TIMSP430F169 microcontroller is shown in Figure 15 (see Appendix for permission to use images).
SYSTEM SOFTWARE
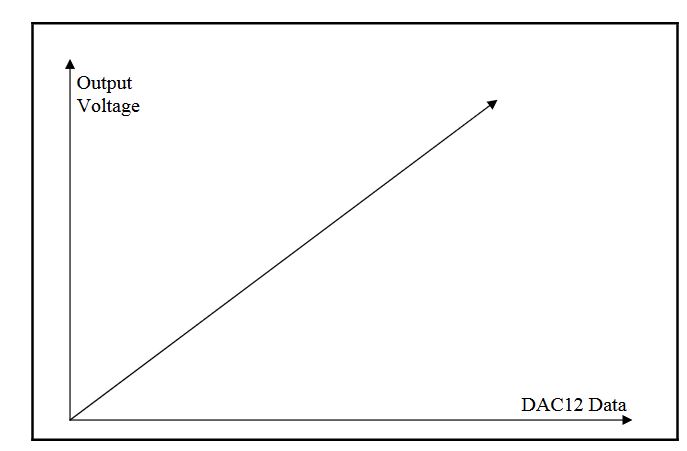
Figure 21 DAC12 Output (binary mode)
The DAC12 data are right-justified so bit 11 is the most significant bit. The output voltage produced by the DAC12 will follow the plot, shown in Figure 23, for a straight binary mode input. The input data follows the x-axis and the out put voltage follows the y-axis.
RESULTS AND CONCLUSIONS
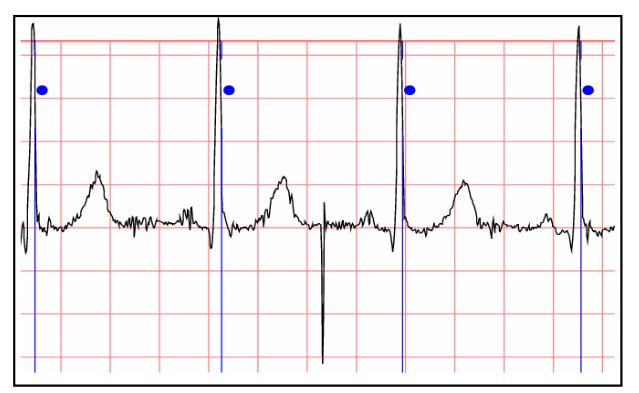
Figure 26 Physionet File stdb_313 Waveform Segment
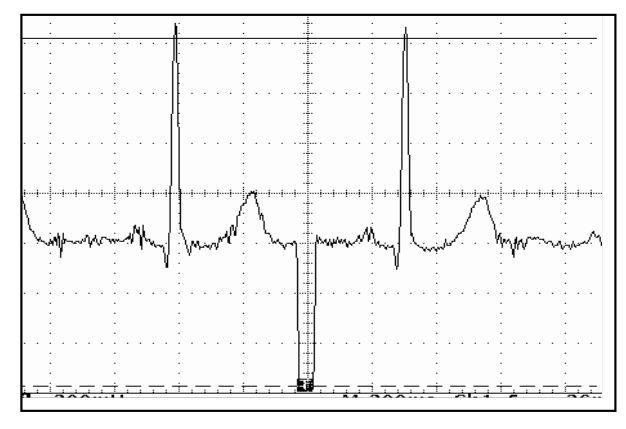
Figure 27 File stdb_313 Snapshot taken on Oscilloscope
Figure 26 and Figure 27 are wave segments from the MIT-BIH data file “cudb_cu01.” Figure 26 is the plot from Physionet and Figure 27 is from the simulator oscilloscope snapshot. Again, this segment was chosen because it is the only area on the one minute waveform where the ECG signal dips down substantially.
Source: University of Central Florida
Author: Paul Michalek