ABSTRACT
Modern embedded systems for digital signal processing (DSP) run increasingly sophisticated applications that require expansive performance resources, while simultaneously requiring better power utilization to prolong battery-life. Achieving such conflicting objectives requires innovative software/hardware design space exploration spanning a wide-array of techniques and technologies that offer trade-offs among performance, cost, power utilization, and overall system design complexity.
To save on non-recurring engineering (NRE) costs and in order to meet shorter time-to-market requirements, designers are increasingly using an iterative design cycle and adopting model-based computer-aided design (CAD) tools to facilitate analysis, debugging, profiling, and design optimization. In this dissertation, we present several profile and instrumentation-based techniques that facilitate design and maintenance of embedded signal processing systems:
1. We propose and develop a novel, translation look aside buffer (TLB) preloading technique. This technique, called context-aware TLB preloading (CTP), uses a synergistic relationship between the compiler for application specific analysis of a task’s context, and operating system (OS), for run-time introspection of the context and efficient identification of TLB entries for current and future us age.
CTP works by identifying application hotspots using compiler-enabled (or manual) profiling, and exploiting well-understood memory access patterns, typical in signal processing applications, to preload the TLB at context switch time. The benefits of CTP in eliminating inter-task TLB interference and preemptively allocating TLB entries during context-switch are demonstrated through extensive experimental results with signal processing kernels.
2. We develop an instrumentation-driven approach to facilitate the conversion of legacy systems, not designed as dataflow-based applications, to dataflow semantics by automatically identifying the behavior of the core actors as instances of well-known dataflow models. This enables the application of powerful dataflow-based analysis and optimization methods to systems to which these methods have previously been unavailable.
We introduce a generic method for instrumenting dataflowgraphs that can be used to profile and analyze actors, and we use this instrumentation facility to instrument legacy designs being converted and then automatically detect the dataflow models of the core functions. We also present an iterative actor partitioning process that can be used to partition complex actors into simpler entities that are more prone to analysis. We demonstrate the utility of our proposed new instrumentation-driven dataflow approach with several DSP-based case studies.
3. We extend the instrumentation technique discussed in to introduce a novel tool for model-based design validation called dataflow validation framework (DVF). DVF addresses the problem of ensuring consistency between (1) dataflow properties that are declared or otherwise assumed as part of dataflow-based application models, and (2) the dataflow behavior that is exhibited by implementations that are derived from the models. The ability of DVF to identify disparities between an application’s formal dataflow representation and its implementation is demonstrated through several signal processing application development case studies.
BACKGROUND
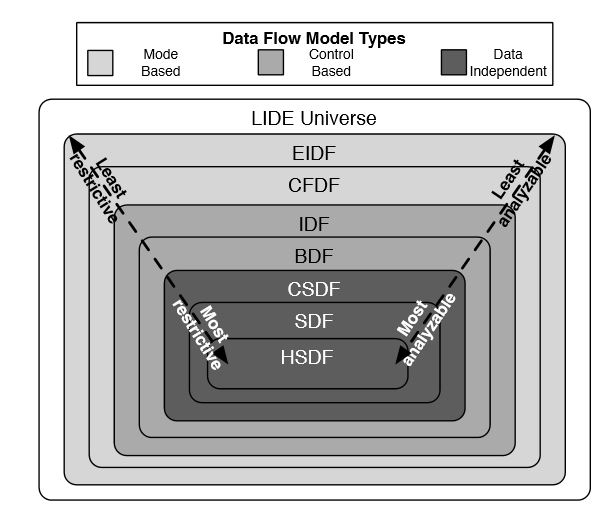
Figure 2.1: A classification of dataflow models supported in the LIDE framework
In homogeneous synchronous dataflow (HSDF), all consumption and production rates are restricted to be equal to unity. Thus, an actor is an HSDF actor if every input port consumes exactly one token per firing and every output port produces exactly one token.
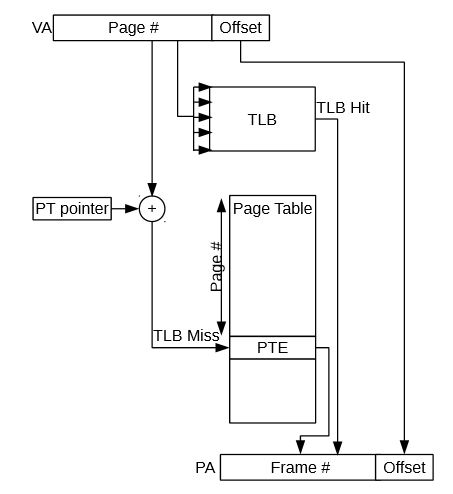
Figure 2.2: The virtual address translation is first attempted using the TLB
The virtual address translation is first attempted using the TLB. If the PTE is present in the TLB, the frame number is retrieved and the PA is formed. If the desired PTE is not present in the TLB, the traditional translation is done by indexing the page table.
CONTEXT-AWARE TLB PRELOADING FOR INTERFERENCE REDUCTION IN EMBEDDED MULTI-TASKED SYSTEMS
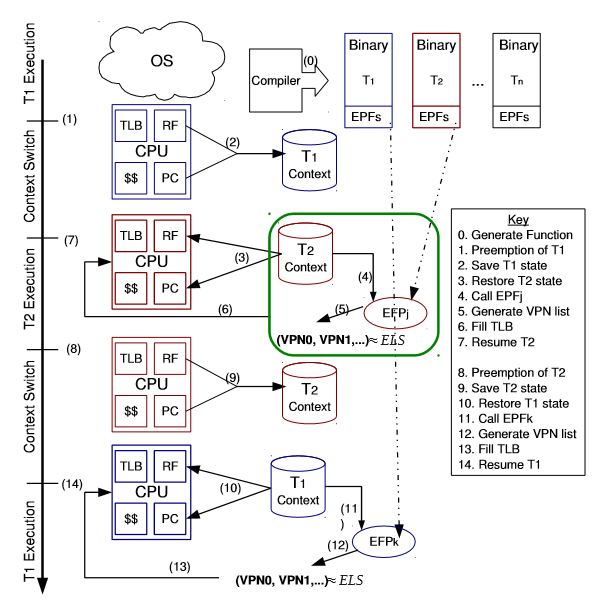
Figure 3.1: High level overview of CTP
This compile-time step corresponds to phase (0) in Figure3.1. The EPFs associated with each task are registered with the OS by using a specially provided API just prior to executing the corresponding loop/function in the task. At run-time, the OS invokes the EPF of the next task when the task is loaded for execution, after preempting the previous task.
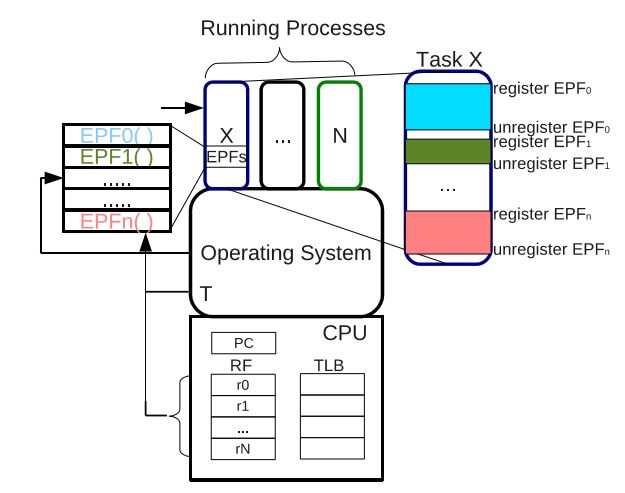
Figure 3.3: Required Operating Systems Modifications
The required operating system support is shown in Figure3.3. The operating system would operate normal, without CTF, until it reaches apart of the program for which a CTF exists. At that time, a system call would be made to setup the use of a CTF for the ensuing context switches. In Figure 3.3, the arrow from OS to EPFs corresponds to the system call which would be made when entering a section of the program for which an EPF exists.
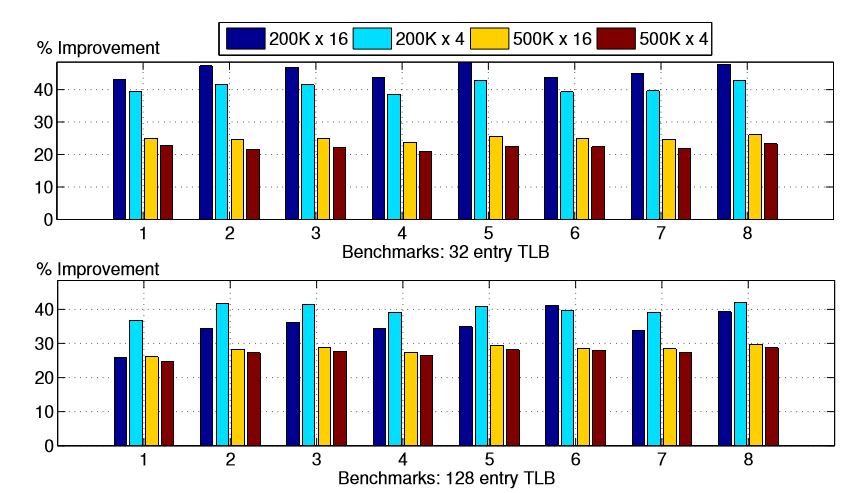
Figure 3.7: ELS Preloading – Overall Miss Improvement
The ELS preservation results are shown in Figure 3.7. The miss-rate improves by more than 20% for all of the configurations. Each group of bars corresponds to overall miss improvement of each benchmark in different configurations. The first two bars in each group show results for 200K process time slice while the last two bars in each group show the 500k process time slice configuration results.
INSTRUMENTATION-DRIVEN MODEL DETECTION AND ACTOR PARTITION ING FOR DATAFLOW GRAPHS
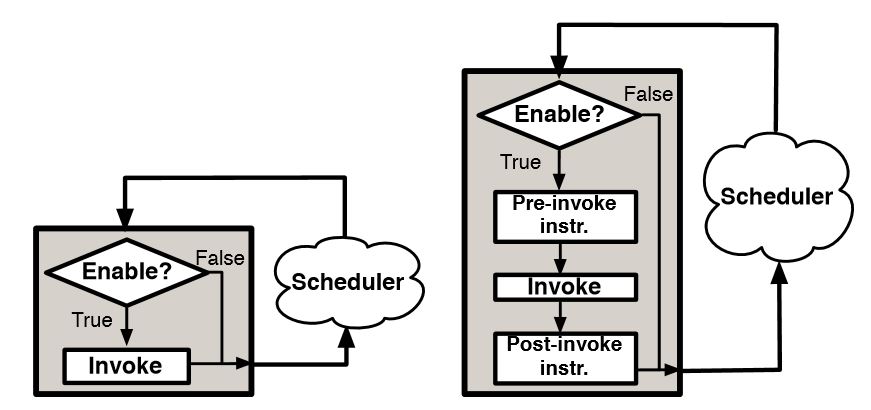
Figure 4.1: Using the enable-invoke interface to instrument dataflow graphs
To support model detection and related applications of dataflow graph instrumentation in a structured way, we propose “instrumentation extensions” just prior to and just after execution of the invoke function, as illustrated in Figure 4.1. By inserting appropriate forms of instrumentation before and after an actor fires, developers can expose powerful insight into the actor’s state, and patterns or useful statistics that can be derived to characterize the progression of actor execution state over time.
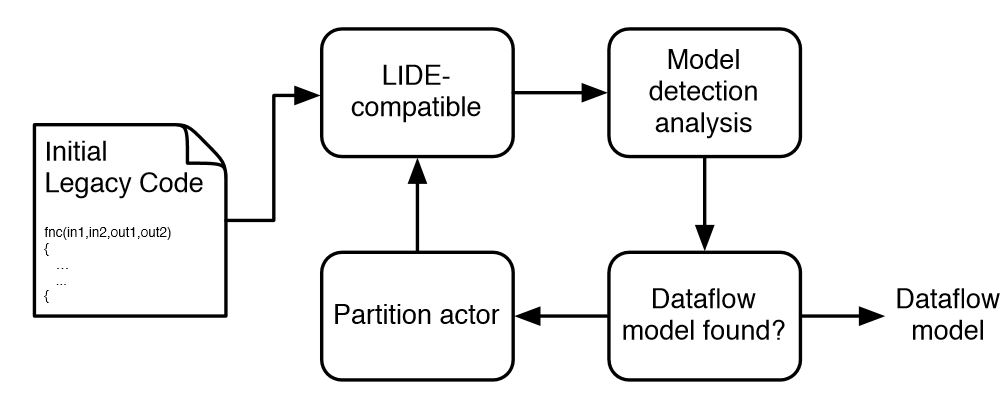
Figure 4.2: Iterative model detection process
Our proposed model detection methodology is illustrated as the iterative process shown in Figure 4.2. The given legacy code is converted to a generic LIDE-compatible data flow format in the first stage. The dataflow instrumentation methodology discussed in the Dataflow Graph Instrumentation section is then used to analyze the LIDE-compatible component and determine whether its behavior matches one of the recognized dataflow models (i.e., one of the models from the universe of supported models). If such a match is not found, the original legacy code can be partitioned into sub-functions.
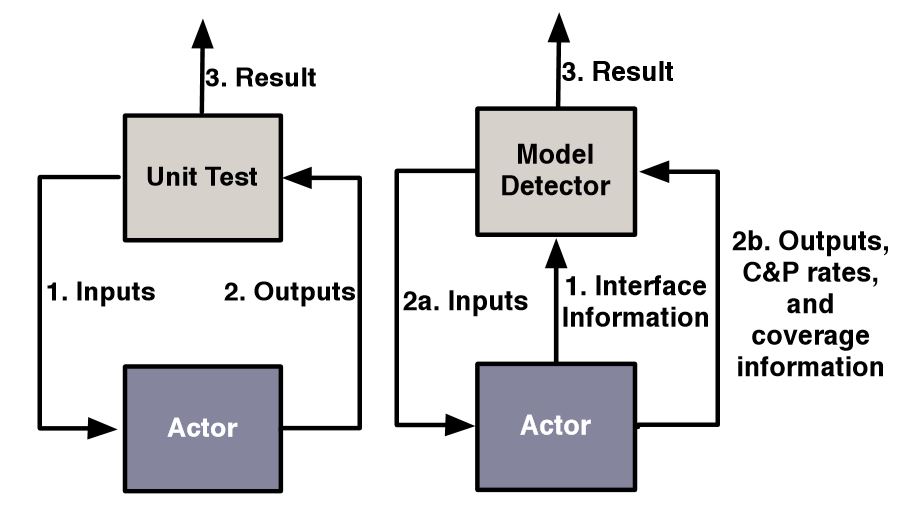
Figure 4.4: The generic unit test can be enhanced to capture the actor’s state information used by our model detection algorithm
A typical unit test is depicted in 4.4(a), where test inputs are fed to the module under test (MUT), which in our context is the intermediate dataflow actor being tested, and the outputs of the MUT are saved in the output file. After all the inputs have been processed, the “outputs” file is compared to the expected outputs.
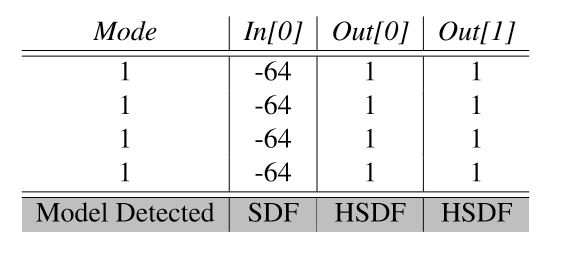
Table 4.1: Instrumentation results for a jet reconstruction actor
SUMMARY
A common problem of modern, high-performance system-on-chip designs is the need for frequent upgrades to keep up with current technology or evolving application requirements. Designers can convert legacy code to dataflow-based implementations to help alleviate this upgrade process, though the conversion can be laborious and time consuming. In this chapter, we have developed a method to facilitate this conversion process by automatically detecting the dataflow models of the core functions, and we have developed techniques to strategically apply the formal model characteristics revealed through such conversion.
We have also developed a generic instrumentation approach that, when combined with traditional profiling tools, can be used to facilitate conversion of legacy designs to DBD semantics. We have demonstrated our instrumentation approach using the light weight dataflow environment (LIDE) framework and the DSPCAD integrative command line environment (DICE). In addition to supporting our proposed model detection features, this instrumentation-driven approach can be useful in debugging dataflow graphs, measuring performance, and experimenting with system design trade-offs.
Third, we have presented an iterative actor partitioning process that can be used to partition complex actors into simpler sub-functions that are more prone to analysis techniques. In the next chapter, we will extend this instrumentation technique to develop a validation framework that can be used to validate dataflow properties in signal processing systems.
Source: University of Maryland
Author: Ilya Chukhman