ABSTRACT
Microphone sensor systems provide information that may be used for a variety of applications. Such systems generate large amounts of data. One concern is with microphone failure and unusual values that may be generated as part of the information collection process. This paper describes methods and a MATLAB graphical interface that provides rapid evaluation of microphone performance and identifies irregularities. The approach and interface are described. An application to a microphone array used in a wind tunnel is used to illustrate the methodology.
MICROPHONE ARRAYS
Modern wind tunnel testing involves multiple diverse sensor systems with anywhere from hundreds to thousands of individual sensors. These large-scale tests can be quite expensive and are usually time-sensitive. As such, any delays due to faulty instrumentation can have serious consequences. Equally serious is the possibility of discovering a sensor failure after the test has been completed because time and effort will have been spent collecting useless information. Although sometimes correctable, the time involved in doing so distracts the experimenter from achieving the experimental goals.
STATISTICAL METHODS
Common failures with microphones include complete failure in which the microphone turns off resulting in a flat signal with low variability, drift of the signal and groups of signals that are different from regular signals. In addition, some microphones exhibit over-range and clipping. Over-range is defined here as having values that exceed normal ranges for the microphone. Clipping occurs when a value, usually at the upper-most or lower-most value, occurs multiple times.
The data set used in this analysis is viewed as consisting of measurements on K microphones or sensors. Each microphone is assumed to have the same starting and ending value and the same number of measurements. The measurements are indexed by a time sequence. Thus, we take xij to be a measurement from microphone i, i = i,2,…,K at time j, j = 1,2,…,T.
SIMULATION RESULTS AND SENSITIVITY MEASURE
One critical decision in outlier and anomaly detection is the numerical criterion for deciding if an observation is sufficiently extreme to be deemed an outlier or potential outlier. While the actual determination might involve other factors and checks on the microphone, the determination of the cutoff is critical as too small a value will result in numerous false signals and too high a value in numerous missed outliers. To evaluate the method and estimate potential error rates, a simulation is used. Data were generated to mimic the microphone data in terms of the number of data points and segment size.
EVALUATION OF MICROPHONE ARRAY DATA
This section describes an experiment that will be used as an example. The experiment is part of a study that focuses on the acoustic effects of a discontinuity or step in an otherwise smooth surface. For example, the surface of a ship may be mostly smooth except for discontinuities in the hull where plates are joined. Such steps may be acoustically loud and interest lies in the study of the effect of steps on acoustic characteristics of flow and the design of efficient low-noise vehicles.
The program was used to evaluate an experimental study using data collected in the Stability Wind Tunnel at Virginia Tech (Blacksburg, VA, USA) (Figure 1). The wind tunnel allows for experiments with anechoic (free from echo) or semi-anechoic conditions. The data evaluated below are part of a study on pressure fluctuations produced by forward steps immersed in a turbulent boundary layer.
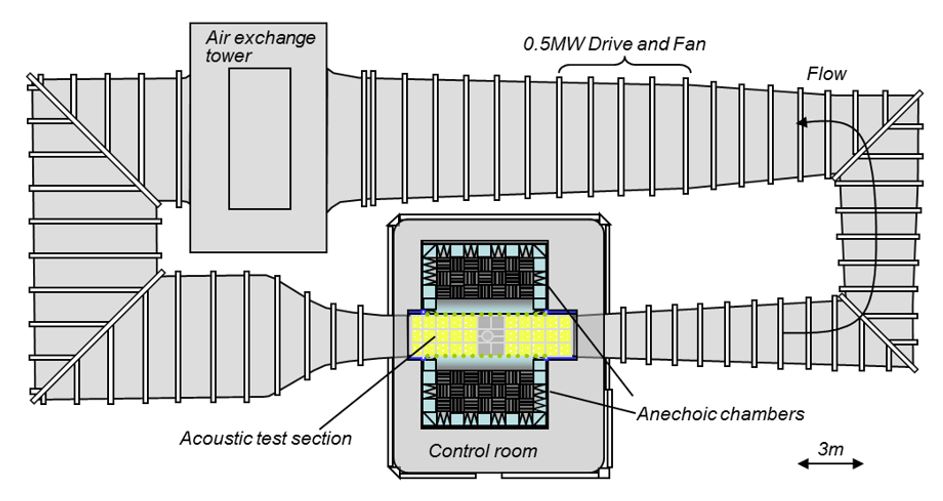
Figure 1. Virginia Tech wind tunnel where microphone array data were collected
In the overall experiment, step sizes of 3.6, 14.6 and 58.3 mm are used with flow speeds of 30 and 60 m/s. A variety of measurements are made including the mean wall Cp, mean velocity profiles, 3D turbulence profiles and wall pressure spectra. Below, we evaluate one part of the experiment with a focus on wall pressure spectra. Measurements are made using 31 wall-mounted microphones placed forward and aft of a sharp step at a particular location (Figure 4). A sampling rate of 51,200 Hz is used. To segment the data, segments of size 51,200 are used resulting in 20 segments.
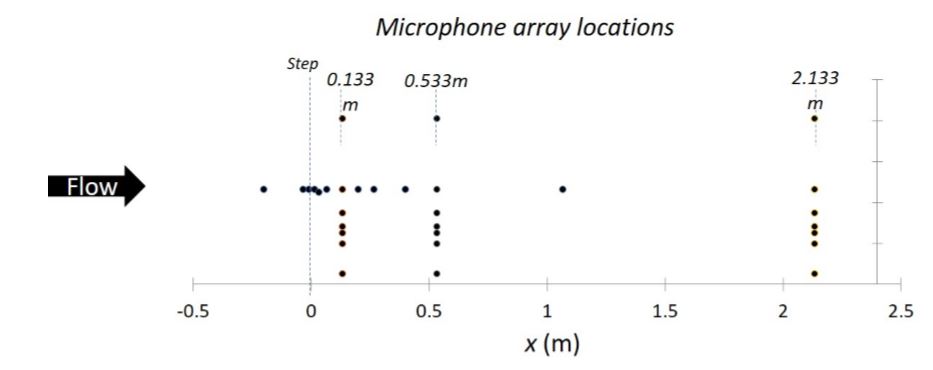
Figure 4. Locations of microphones to collect array data
CONCLUSIONS
The MATLAB Graphical User Inteface (GUI) allows rapid evaluation of microphone data quality and identifies extreme segments, microphones that are not functioning as well as clipping and over range. In an example with 31 microphones, we identified three microphones that were not functioning and several microphones with clipping. Identification of these issues may lead to improved analysis of the information in the microphone system. The GUI provides some flexibility for a user.
This includes selection of the critical threshold for identifying unusual groups of observations. It is recommended that the user use the GUI with some data of known quality to identify the threshold prior to use on experimental data. We have found the threshold of three to be somewhat liberal with real data, i.e., it tends to identify unusual observations that do not affect resulting analyses. Evaluation of individual series using a Bonferroni correction can also be helpful in selecting the critical threshold. The GUI can be extended in a number of ways. First, more interactive plots can be added.
Although not included in this version of the GUI, we have a feature that allows interactive evaluation of data by allowing the user to click on a suspected spectrum to visualize the series that is suspect. A future implementation will focus on systems with multiple sets of sensors and correlated systems. The current analysis treats the microphones as providing independent information. To incorporate correlation, a Gaussian Process approach is being developed that allows for both correlation between microphones of the same and different types of sensors while maintaining the non parametric nature of the analysis.
Authors: Robert Vasta | Ian Crandell | Anthony Millican | Leanna House | Eric Smith
>> Matlab Projects Fingerprint Recognition and Face detection for Engineering Students
>> More Matlab Projects on Signals and Systems for Engineering Students