ABSTRACT
The thesis describes broadband supercontinuum (SC) generation in optical fibers for both the visible and mid-infrared regions of the spectrum, and their respective application to 3D imaging and stand-off reflection spectroscopy. Both SC sources leverage mature telecom technology, and are based on a common all-fiber integrated platform comprising a ~1.55 μm distributed feedback seed laser diode amplified to high peak powers in two stages of cladding pumped Erbium or Erbium-Ytterbium fiber amplifiers.
A visible SC extending from 0.45-1.20 μ m with 0.74 W of time-averaged power is demonstrated using a two step process. The output of the Er-Yb power amplifier is frequency doubled to ~0.78 μm using a periodically poled lithium niobate crystal, followed by non-linear spectral broadening in 2m of high non-linearity photonic crystal fiber. Numerical simulations based on solving the generalized non-linear Schrodinger equation are also presented to verify the underlying SC generation mechanisms and predict further improvements.
The above SC source is used in a Fourier domain line scan interferometer to measure the height and identify shape defects of ~300 μm high solder balls in a ball grid array. The 3D imaging system has an axial resolution of ~125 nm, transverse resolution of ~15 μm, and an angular measurement range between 20 to 60 degrees depending on the sample surface roughness.
The mid-infrared SC source is generated by pumping a 9m long ZrF4-BaF2-LaF3-AlF3-NaF (ZBLAN) fiber to obtain a spectrum spanning 0.8 – 4.3 μm with 3.9 W time-averaged power. The output power is linearly scalable with pump power, but requires optimization of the critical splices and thermal management of the gain fiber and pump diodes to ensure stable high power operation.
Finally, an application of the mid-IR SC is demonstrated by measuring the diffuse reflection spectra of solid samples at a stand-off distance of 5 m and 100 ms integration time. The samples can be distinguished using a correlation algorithm based on distinct spectral features in the reflection spectrum. Signal to noise ratio calculations show that the distance is limited by space constraints in our lab and can be extended to ~150 m.
VISIBLE SUPERCONTINUUM GENERATION IN PHOTONIC CRYSTAL FIBER
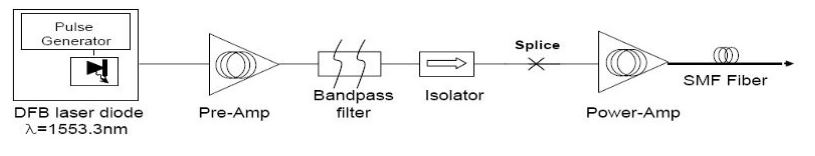
Fig. 2.1. All fiber integrated high power 1553 nm pump system
A block diagram of the all fiber integrated high power pump system at 1.55 μm is illustrated in Fig. 2.1. A 1553 nm DFB laser diode is driven by a pulse generator to produce 2 ns pulses at variable repetition rates and amplified using dual stage fiber amplifiers. The first stage consists of a 1 m long 4/125 μm Erbium doped fiber amplifier (EDFA) forward pumped by a 400 mW 980 nm single mode laser diode.
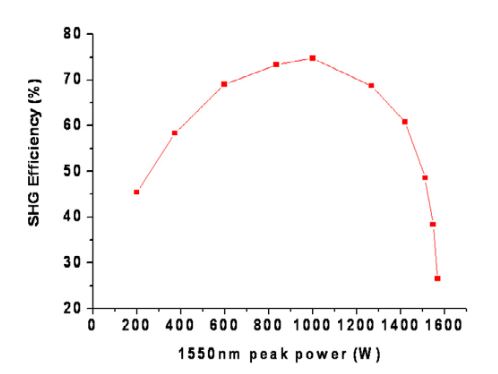
Fig. 2.3. SHG efficiency versus peak pump power
To reduce non-linearity, the length of the SMF-28 output fiber in the power-amp was shortened to ~0.5 m. Next, the input peak power was varied to obtain maximum SHG efficiency ~70% at 1 kW (Fig. 2.3). The theoretical efficiency for a lossless crystal at the given peak power is ~99%. But, the transmission loss through the crystal at low power was measured to be ~30%, and thus the maximum conversion efficiency possible experimentally was achieved.
HIGH RESOLUTION LINE-SCAN 3D IMAGING SYSTEM FOR SOLDER BALL INSPECTION
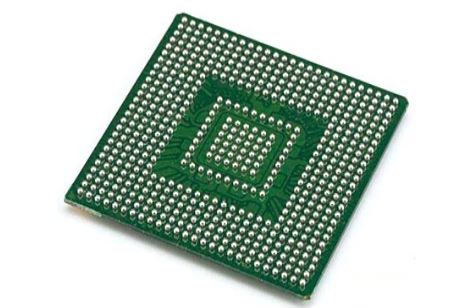
Fig. 3.1. Solder ball grid array
The continuous reduction in size of semiconductor devices has led to an increased density of chips on a wafer. Consequently, conventional wire leads that extend outside the chip’s physical dimensions are being replaced by solder ball grid arrays (Fig. 3.1) that can directly be flip-chip bonded with an external circuit. The reliability of electrical contact depends on the shape and size of solder balls deposited on the chip, and, thus, inspection of the balls is very important for quality control.
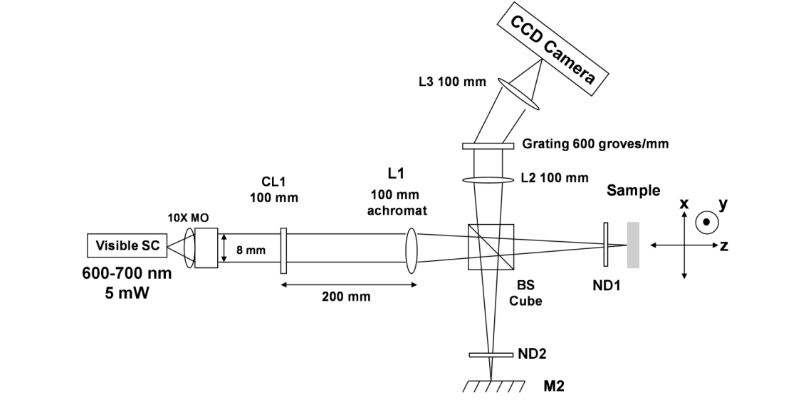
Fig. 3.2. Experimental setup for visible SC based Fourier domain line scan interferometer
Figure 3.2 illustrates the optical layout for the line scan interferometer. While the setup resembles a conventional point-scan FD-OCT system, the introduction of a cylindrical lens and replacement of a 1D array with a 2D CCD camera enables the measurement along an entire line instead of a single point with each camera image. The interferometer layout was modeled using ZEMAX software to provide the best imaging performance using standard off-the-shelf optics.
MID-INFRARED SUPERCONTINUUM GENERATION IN ZBLAN FIBER
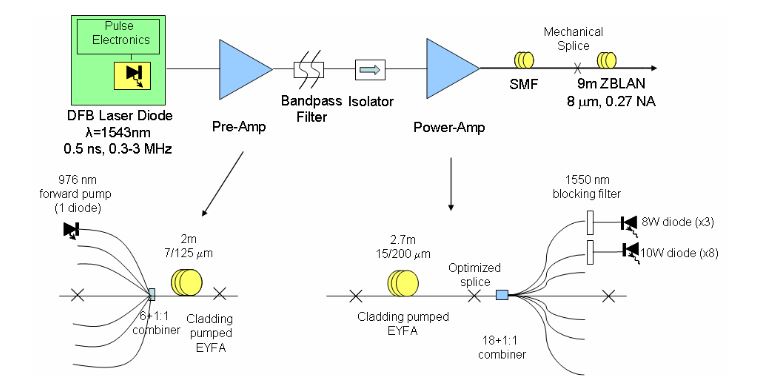
Fig. 4.1. Experimental setup for mid-IR SC generation
Figure 4.1 below shows the layout of the system used for generation of the mid-IR SC extending from 0.8–4.3 μm. First, a pulse generator is used to produce 0.5 ns pulses at variable repetition rates from a 1543 nm DFB seed laser diode. The entire system was modulated at 500 Hz with a 50% duty cycle to reduce the thermal load on the various components.
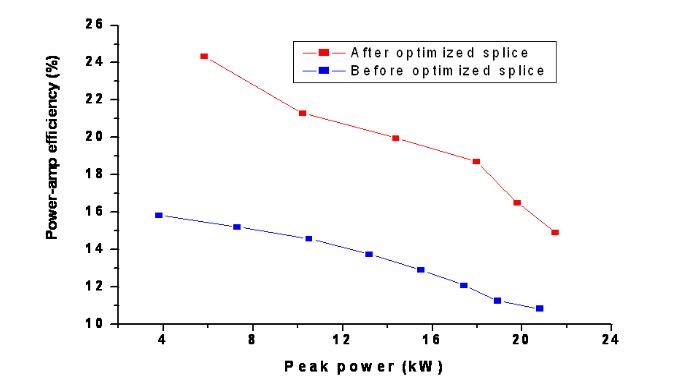
Fig. 4.3. Power-amp efficiency versus peak power before and after optimized splice
The power-amp efficiency (power-amp average output power/input pump power) as a function of output peak power is shown in Fig. 4.3 and was measured both before and after optimization of the splice. In both cases, there is a decrease in efficiency with increasing peak power due to non-linear spectral broadening of the signal within the gain fiber itself.
STAND-OFF REFLECTION SPECTROSCOPY USING A MID-INFRARED SUPERCONTINUUM SOURCE
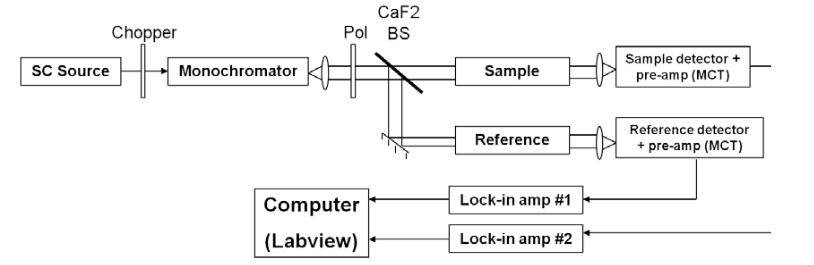
Fig. 5.1. Experimental setup for SC based transmission spectroscopy
The experimental setup for a SC based transmission spectroscopy system is shown below in Fig. 5.1. The mid-IR SC described in Chapter 4 is used as the light source for the experiments. First, the light exiting from the output ZBLAN fiber of the SC source is collimated using a CaF2 lens and then focused into the entrance slit of the monochromator.
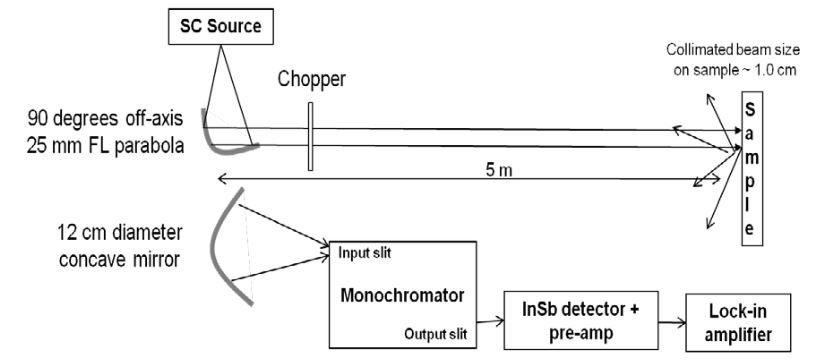
Fig. 5.6. Experimental setup for SC based stand-off diffuse reflection spectroscopy
While the results of the previous section proved the feasibility of using the SC light source for transmission spectroscopy applications, a stand-off detection system must necessarily operate in the reflection mode. The experimental setup for a reflection spectroscopy based stand-off detection system is shown in Fig. 5.6. First, the diverging SC output from the ZBLAN fiber is collimated to a 1 cm diameter beam using a 25 mm focal length, 90 degrees off-axis, gold coated, parabolic mirror.
SUMMARY AND FUTURE WORK
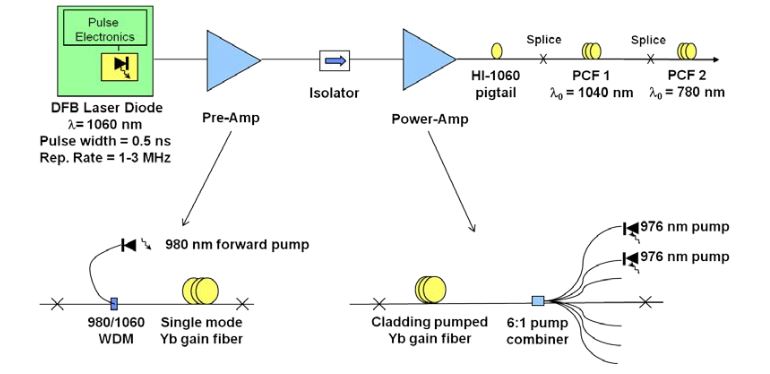
Fig. 6.1. Proposed experimental setup for visible SC generation using a 1060 nm Yb amplifier
If the first stage was instead changed to a dual stage 1060 nm Ytterbium (Yb) fiber amplifier and spliced to a PCF with anomalous dispersion at the pump wavelength, we could obtain SC generation in the visible region. Travers et. al demonstrated that by cascading two PCFs with decreasing zero dispersion wavelength, the short wavelength edge of the SC could be extended down to 450 nm. The proposed experimental setup for visible SC generation using the above scheme is shown in Fig. 6.1.
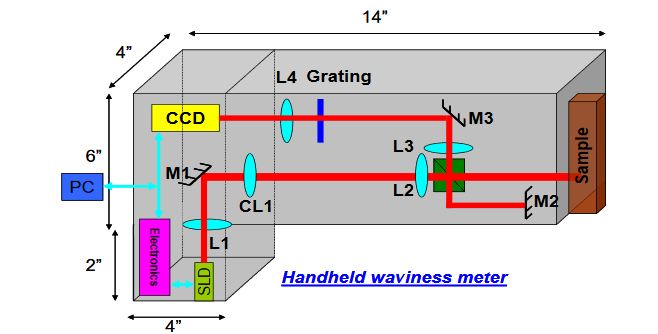
Fig. 6. 2. Design of a line scan system based hand-held waviness meter
A possible design of such an instrument is shown below in Fig. 6.2. In order to make the system compact, the visible SC source has been replaced with a superluminescent laser diode (SLD) source. The advantages and disadvantages of this source over the SC source have already been discussed previously in Section 3.5. The setup is in principle identical to the setup from Chapter 3 with mirror M2 and the sample positioned at the ends of the two arms of the interferometer.
Source: The University of Michigan
Author: Malay Kumar