ABSTRACT
The objective for this project is to investigate various electrical and software means of control to support and advance the development of a novel vacuum adhesion system for a wall-climbing robot. The design and implementation of custom electronics and a wirelessly controlled real-time software system used to define and support the functionalities of these electronics is discussed. The testing and evaluation of the overall system performance and the performance of the several different subsystems developed, while working both individually and cooperatively within the system, is also demonstrated.
BACKGROUND RESEARCH
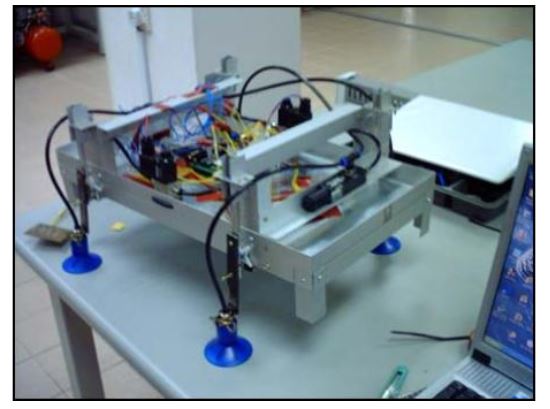
Figure 3: Four-legged slider-crank suction powered wall-climbing robot system
With these systems, all of the supporting circuitry has already been developed and integrated with the microcontroller, allowing the user to simply plug in their equipment and easily integrate electronic control into their system. This particular robot, pictured in Figure 3, utilized the BASIC Stamp BS2 module, which runs using the PBASIC programming language through a serial connection to a computer.
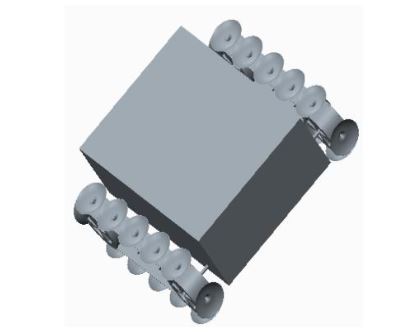
Figure 7: Robot developed with suction cups mounted to drive belts used for adhesion
Many robots have developed ingenious adhesion systems that actively maintain contact between the base of the robot and the wall. One team ideated a robot, seen in Figure 7, whose drive belts function to not only drive the robot forward or backwards, but also to engage and disengage the suction to the wall. This was accomplished by securing 24 suction cups perpendicular to the drive belts, which are cyclically pressed against and pulled off of the wall, creating suction at each active suction cup.
DESIGN AND IMPLEMENTATION
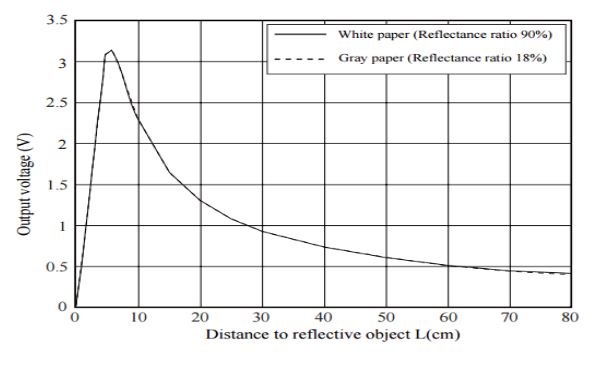
Figure 12: Non-linear output voltage versus distance of object located in front of Sharp proximity sensor
Since the maximum output speed of the selected gearmotors was 25 RPM, the robot would theoretically travel a maximum of 3.5 inches per second, so the proximity sensors did not need to sense objects from far away. However, the output behavior was highly non-linear, as seen in Figure 12. Because of this, the sensors needed to be tested to verify the behavior predicted by the sensor documentation.
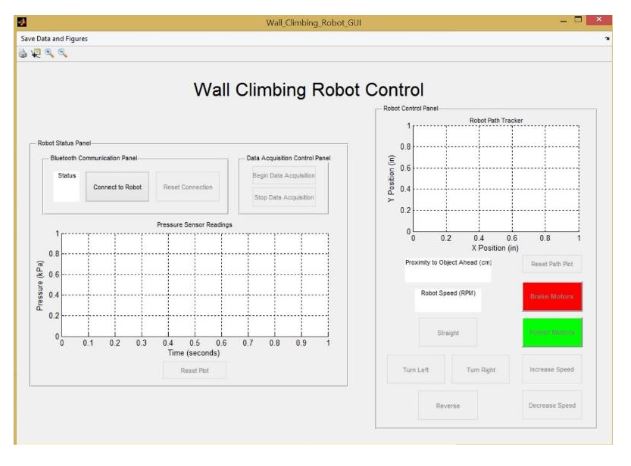
Figure 14: MATLAB graphical user control interface with buttons and data readouts
Several features needed to be included in the interface in order for the user to have full control of the robot behavior and monitor the current state of the robot, including the speed and Bluetooth connection status, as shown in Figure 14. Motor control buttons were implemented and could be controlled using keyboard inputs, as well. Bluetooth connection buttons and a status indicate or were included, also.
TESTING AND RESULTS
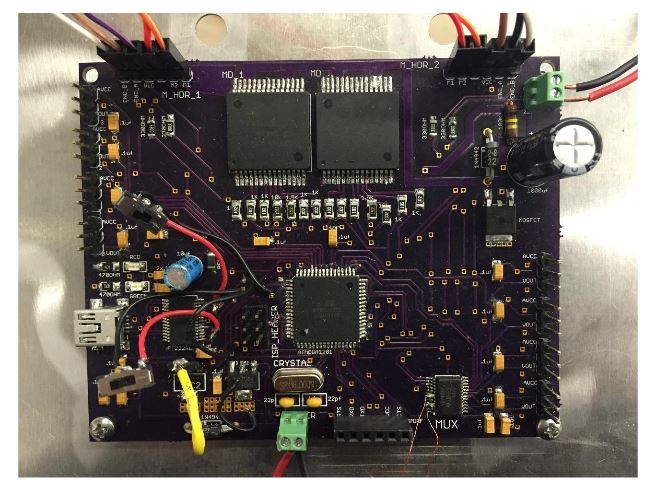
Figure 15: Final circuit board layout after circuitry issues were resolved
The circuit board was surprisingly bug-free, with only a few bugs being discovered and resolved. The final board layout can be seen in Figure 15. The revised circuit board wiring diagrams and schematic can be found in Appendix A. The first issue with the board was with the analog voltage regulator. An attempt to mirror the analog voltage regulator on the board schematic resulted in the input and output pins for this regulator being swapped, meaning the supply voltage for the board was being placed on the output p in of the regulator.
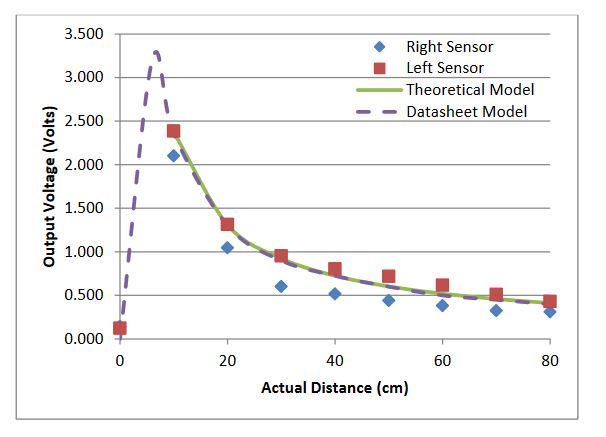
Figure 17: Left and right sensor output results from repeatability test compared directly to the theoretical model and the predicted sensor output behavior from the sensor datasheet
The data obtained from the repeatability test was directly compared to the theoretical and datasheet models. As seen in Figure 17, the left and right sensor results followed very similar trends, yet were slightly offset from one another, with the left sensor consistently producing higher results. The theoretical model most closely matched the behavior of the left sensor, while still being between the left and right sensor outputs.
CONCLUSION
Overall, the development of this electronic system was quite successful. The robot was fully functional and could be easily controlled using the graphical user interface. Additionally, the robot position, speed, pressure values, and object proximity data were effectively and accurately updated within the interface so that the user was able to monitor the current status of the robot’s various subsystems. However, several things could be done to improve the overall performance of the system. Primarily, a more robust collision avoidance system should be implemented.
Although the proximity sensors provide accurate object proximity measurements, the non-linearity of the sensor output introduced error into the calculation. One improvement that could be made to the graphical user interface system would be to speed up the reading of the serial data from the Bluetooth module. The “query” function was used to send the module a command to send the data to the interface and then read the data as text. However, this function requires around 0.2 seconds to run, thus limiting the data acquisition sampling period to 0.2 seconds.
The internal MATLAB timer was used to obtain data every time the period time elapsed, but the timer was able to run a period as fast as 0.01 seconds. This faster period would be preferred in order to sample the pressure sensor data more quickly and enable the user to see the true behavior and status of the vacuum pressure system. The circuit board could also be reprinted and soldered to incorporate the board revisions. Lastly, a rate gyro sensor could be implemented to directly measure the angular position and velocities associated with the skid turning, replacing the indirect calculation of these values using the encoder reading and not requiring testing on the effects of tread slip.
Source: California Polytechnic State University
Authors: Lynda Beatriz Tesillo
>> 200+ Matlab Projects based on Control System for Final Year Students
>> 80+ Matlab Projects based on Power Electronics for Engineering Students
>> More Wireless Bluetooth Projects for Engineering Students
>> More Wireless Projects Using Microcontroller for Final Year Students