ABSTRACT
The Wuhan Ionospheric Oblique Backscattering Sounding System with the addition of an antenna array (WIOBSS-AA) is the newest member of the WIOBSS family. It is a multi-channel radio system using phased-array antenna technology. The transmitting part of this radio system applies an array composed of five log-periodic antennas to form five beams that span an area to the northwest of the radar site.
The hardware and the antenna array of the first multi-channel ionosonde in the WIOBSS family are introduced in detail in this paper. An ionospheric detection experiment was carried out in Chongyang, Hubei province, China on 16 March 2015 to examine the performance of WIOBSS-AA. The radio system demonstrated its ability to obtain ionospheric electron density information over a wide area. The observations indicate that during the experiment, the monitored large-area ionospheric F2-layer was calm and electron density increased with decreasing latitude.
SYSTEM DESCRIPTION
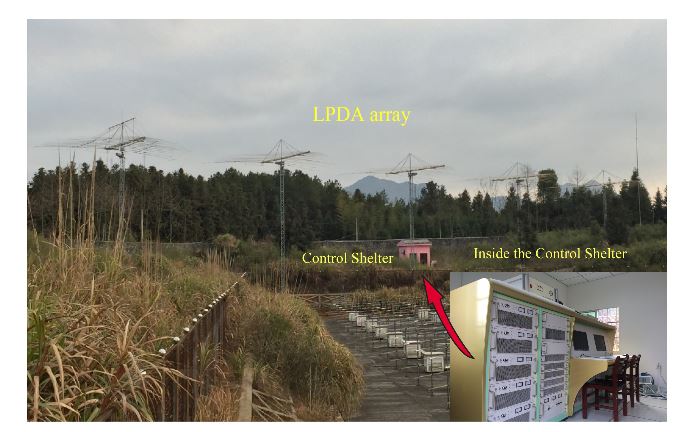
Figure 1. Photo of WIOBSS-AA site showing the log-periodic antenna array. The pink building in the center of the photo is the shelter of the hardware
The development of the WIOBSS has benefited from the ascent of digital techniques since the 2000s. There have been a lot of changes and upgrades on the hardware and system architecture of the WIOBSS in recent years. The WIOBSS-AA is the latest system of the WIOBSS family, which is also a totally functionally-upgraded system. The most significant change is the application of the log periodic antenna array, which is located in Chongyang, Hubei province, China (29.53° N, 114.14° E), as shown in Figure 1.
DIGITAL BEAM-FORMING
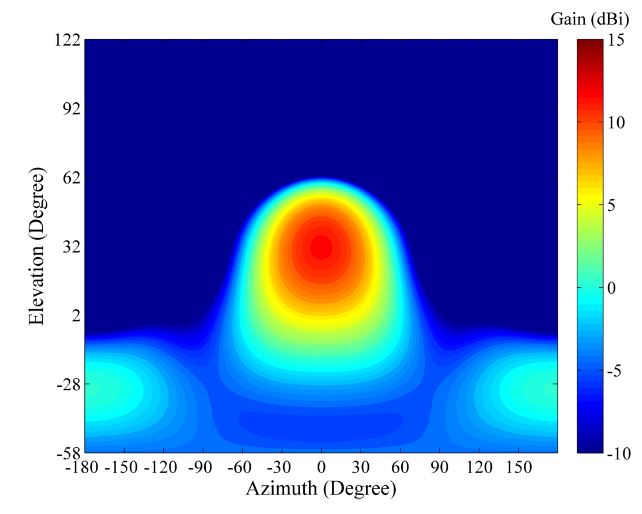
Figure 4. Computed radiation pattern of a single LPDA at 10 MHz (main lobe vector alignment), where dBi values are with reference to an isotropic gain pattern
The antenna of the WIOBSS-AA was designed and validated by the Computer Simulation Technology MICROWAVE STUDIO (CST MWS) (Bad Nauheimer Strasse, Darmstadt, Germany). Each element of the LPDA is formed by wires in the model. The LPDA is excited by a voltage source. The simulations are performed for ground environment using lossless ground approximation. The computed radiation pattern of a single LPDA is shown in Figure 4.
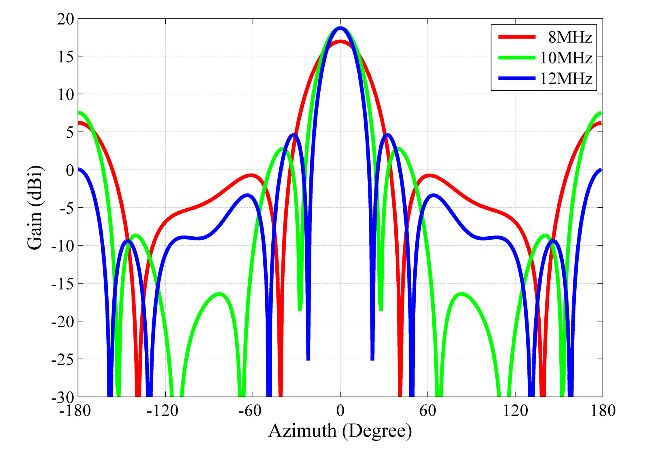
Figure 7. Comparison of the antenna array radiation patterns at 8 MHz (red line), 10 MHz (green line), 12 MHz (blue line) (main lobe vector alignment), where dBi values are with reference to an isotropic gain pattern
How changing the frequency affects the beam pattern of the array is demonstrated in Figure 7. The antenna radiation pattern of the antenna array has a half power beam width of 32.3° at 8 MHz (red line), 22.8° at 10 MHz (green line), and 19° at 12 MHz (blue line). The width of the beam decreases with the increased frequency. Unfortunately, the sidelobe and backlobe rise with decreased frequency. The beam pointing of the array has different elevation for different frequency.
ARRAY CALIBRATION
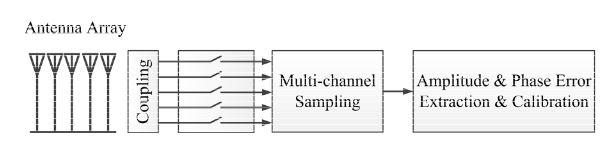
Figure 9. Calibration section of the WIOBSS-AA
In the WIOBSS-AA, the couplers are installed at the root of each antenna, as shown in Figure 9. All of the transmitting channels are calibrated by setting the amplitude registers and the phase offset registers of AD9911 to obtain great amplitude and phase consistency before monitoring. The whole array calibration consists of two steps, the first step is internal calibration with small calibration signals that are routed to the couplers and then through multichannel sampling, so that amplitude and phase error can be extracted and calibrated.
ULTRA-WIDE IONOSPHERIC MONITORING
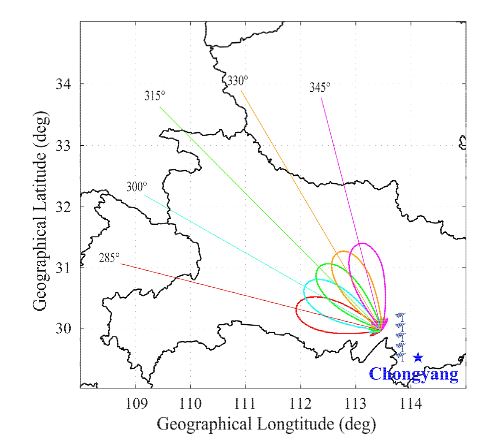
Figure 10. Map showing the location of the WIOBSS-AA in Chongyang, Hubei province, China and the antenna pointing in the experiment of 16 March 2015
The location, as well as the five beam direct ions, of WIOBSS-AA is shown in Figure 10. The log-periodic antennas pointed northwest. Due to being a phased antenna array, the WIOBSS-AA is able to cover the large-area ionosphere with only 500 W peak power.
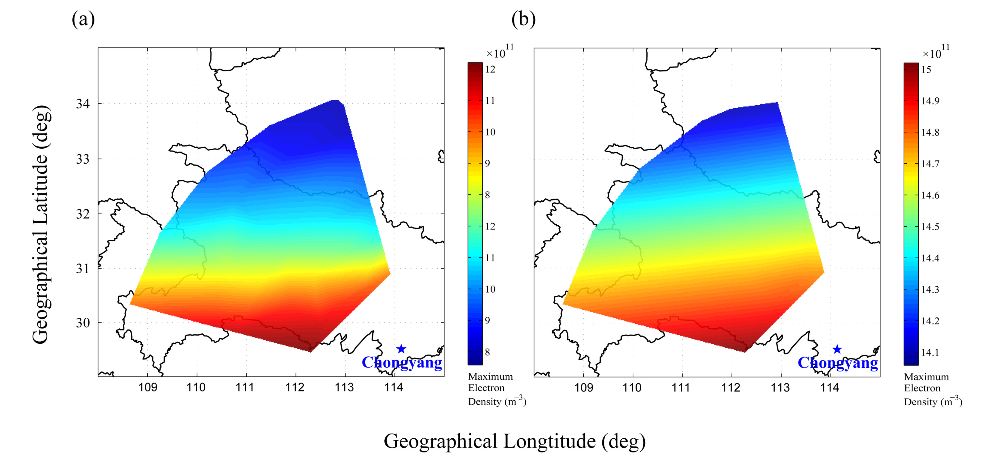
Figure 15. Comparison of the maximum electron density maps between the inversion results obtained from the five two-dimensional ionospheric electron density distributing plots (a) and the IRI-2012 model (b)
The maximum electron density in the two-dimensional ionospheric electron density plots of the five beams is extracted and then used to compose the maximum electron density map over a fan-shaped region as shown in Figure 15a by applying a two-dimensional interpolation algorithm. Over the observing region, lower maximum ionospheric electron density is found in the more northerly region. A longitude difference in the electron density distribution is not obvious. Using the IRI-2012 model data, the similar result is also gotten, as shown in Figure 15b.
CONCLUSIONS
This present paper describes the design and application of the WIOBSS-AA. It is the first multi-channel radio system applying the log-periodic antenna array in the WIOBSS family. It can monitor the large-area ionosphere with five antenna beams and provide the electron density information over the observed region.
The electron density profiles and the two-dimensional maximum electron density map over the observing region can be obtained only with the WIOBSS-AA radio system. More log-periodic antennas will be added to increase the azimuth resolution. The measuring technique for the echo elevation angle is also in development. It will be very important for improving the inversion of the ionospheric electron density.
Source: Wuhan University
Authors: Xiao Cui | Gang Chen | Jin Wang | Huan Song | Wanlin Gong
>> Smart Antenna Design Final Year Projects for Engineering Students