ABSTRACT
A major part of modern manure management is accurate application records; a key to their creation and maintenance is ease. This project involved the integration of existing technologies (smartphones, Bluetooth tags) in mobile web and native Android applications (apps) which enable the autogenic creation and upkeep of manure hauling records.
This approach greatly improves the efficiency of the recording process which should help to improve the management of applied nutrients. Features of the app include: computation of a suggested travel speed to ensure target nutrient application (based on desired application rate and spreading width); minimized keystrokes/screen taps to accurately capture data for source, date, time, spreader, operator, georeferenced spread path, and field; and data export for later aggregation and analysis.
Autonomous operation was facilitated with a Bluetooth capable sensor tag which can automatically detect the spreader identity and spreading status (via accelerometer readings). The GPS capability of mobile devices facilitated the automatic detection of field and the creation of the georeferenced spread path. The app was developed in stages and initially developed as a web app; Apache Cordova was then used to convert the code into a native app which can operate in the background, giving near autonomous operation. This app approach could be readily adapted to other field operations in agriculture and related industries.
LITERATURE REVIEW
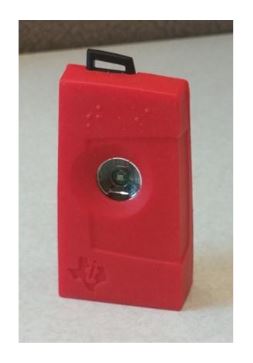
Figure 2: Texas Instruments CC 2541 Sensor Tag
The Texas Instruments CC2541 sensor tag (Figure 2) is a Bluetooth low-energy (BLE) tag that is capable of connecting to a mobile device with the purpose of transmitting contained sensor data for extending application functionality (Texas Instruments, 2015). The sensor tag includes six sensors inside a rubber shock resistant case.
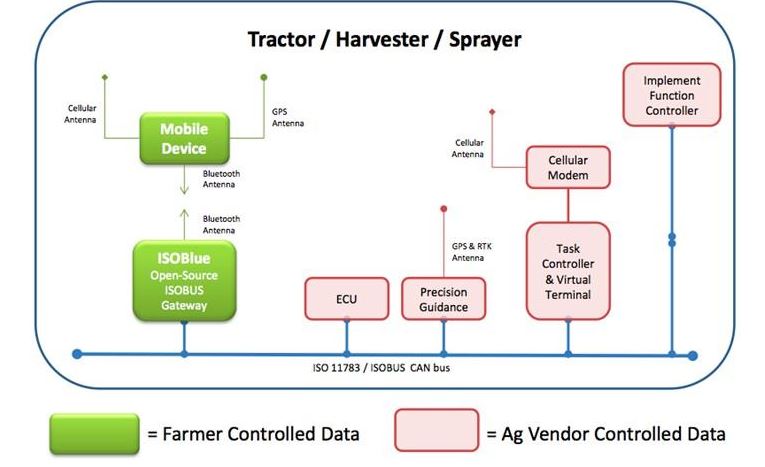
Figure 3: Implementation of ISOBlue with a Tractor’s CAN Bus (ISOBlue, 2014)
As systems exist currently, use of the data for decision making and record keeping is constrained by software compatibility. The ISOBlue hardware (Figure 3) attaches to the tractor’s controller area network bus (CAN Bus) via a diagnostic port and logs the parameter group number (PGN) as well as the data. The PGN identifies the message content (e.g., start power-take-off (PTO) shaft, activate hydraulic channel one, increase engine RPM, etc.)
METHODS
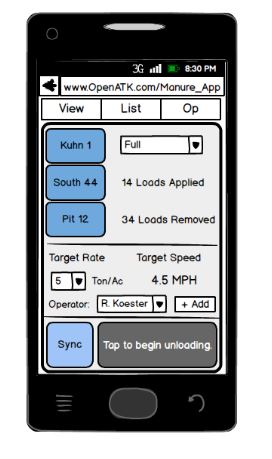
Figure 4: Approved UI Design of the Manure App Main Page/Dashboard
Using Balsamiq, mockups were created displaying a proposed UI. A key aspect of the Manure App design is the “Dashboard”– a main screen of the app that would impart the most important information to the user at a glance (Figure 4). Based on the field (which includes a desired spread rate) and spreader chosen, the dashboard displays a suggested speed of application.
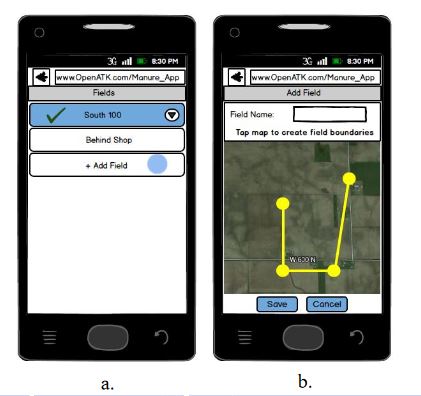
Figure 6: Field selection (a.) and drawing a field boundary (b.)
Later versions of development (versions 2.0 and 3.0), will have the ability to include field boundaries. Mockups were created showing how the user could navigate to the add field boundary tool in the manure app (see Figure 6).
RESULTS
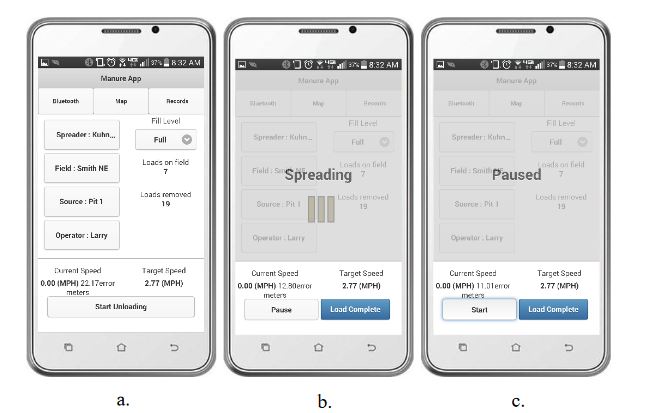
Figure 20: Final dashboard design (a.), spreading overlay and animation (b.), and paused indication for when the user wants to pause the unloading process (c.)
The Final UI was completed and the screenshots are displayed below (see Figure 20 through 22). The UI is split up into four main portions of the app and its functionality: the dashboard and the spread event functionality, the object (field, spreader, source, and operator) lists showing the available objects and the current object being used for data collection, the Bluetooth connectivity page, and the Google Maps being implemented.
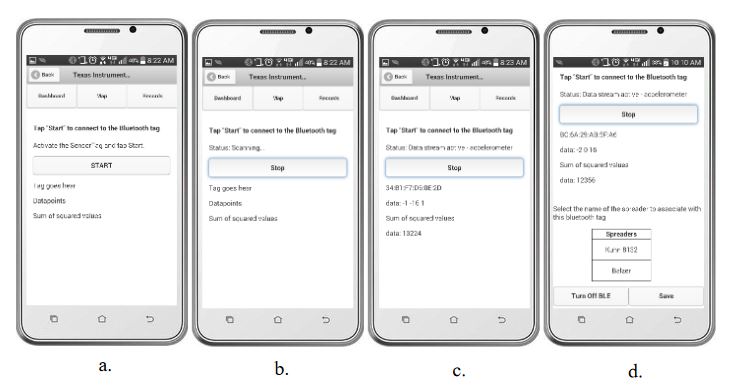
Figure 22: UI of connection process to the Bluetooth sensor tag. The main page not connected
The ability for the Manure App to connect to an external Bluetooth enabled accelerometer sensor enables autogenic data collection. An interface was needed for the user to select the connection action and the ability to select a specific Bluetooth tag to be referenced to each spreading implement (see Figure 22).
CONCLUSION AND RECOMMENDATIONS
This project consisted of the development of a platform independent application capable of recording data pertaining to manure hauling events. Development occurred in three main stages leading to the final app created in version 3.0. Final app testing was conducted simulating manure hauling operations to create application maps of each field coverage.
Version 1.0 was developed creating a basic dashboard showing the number of loads applied to each field and the number of loads taken from each source. The load numbers were updated after a cycle of the user pressing “Start Unloading” and then “Load Complete” buttons. Separate pages were created for listing each type of object containing specific characteristics created by the user for each field, spreader, operator, and source.
Source: Purdue University
Author: Matthew R. Koester