ABSTRACT
Personal computing devices have gone through more than four decades of evolution. The form factor of computing devices has gone down dramatically, while computation workload for each computing device has increased significantly. Moreover, people spend much more time interacting with computing devices than before. In short, everyone has a pocket supercomputer.
Delivery of intelligent services today is only possible thanks to rich context information from wearable devices, an emerging personal computing platform. Power efficiency is one of the determinant factors for the adoption rate of wearable devices, as people expect it to work 24/7.
Most existing works often pay careful attention to the energy and processing cost from the component level and show significant power efficiency gain by utilizing device level power management. Even with an abundance of such work, power optimization on wearable devices remains as an open problem, and available solutions only manage to provide weeks of continuous user experience before a battery recharge. To this end, this dissertation systematically measures and quantifies power characteristics of a wearable computing system, then explores adaptive approaches to best balance power consumption and user experience.
A methodological application agnostic, yet practical, power optimization framework built upon adaptive sensing and communication management, is proposed and tested in several research projects. On top of that, we propose Gazelle, a personalized running analysis wearable system. Gazelle has been tested in the real world on more than fifty users over a year. It provides one order of magnitude better battery life comparing to other commercialized wearable platforms. The methodology and proposed framework can be readily extended to other application dependent wearable computing platforms.
RELATED WORK
Personalized Service Delivered from Mobile Sensing System
Sensing systems that utilize mobile platform and other devices such as GPS, accelerometer, and OBD device, have been developed for monitoring road and traffic conditions, commute time, WiFi deployment, and automotive diagnostics, or finding the optimal route in terms of lowest fuel consumption. These systems require purchasing extra devices, which limits user adoption. Privacy of driving trips has also been studied.
Several techniques have been proposed to classify a wide variety of human movements and activities using mobile device. However, previous works typically require stable sensor placement for data collection, e.g., mounting the phone in a fixed place. Such requirement is intrusive and inconvenient for users. During a driving trip, the phone may move relative to the vehicle (e.g., sliding or user picking up a phone call). Such abnormal movements make statistical models inadequate and affect the quality of monitored data.
DBMA: PERSONALIZED DRIVING BEHAVIOR MONITORING AND ANALYSIS FOR EMERGING HYBRID VEHICLES
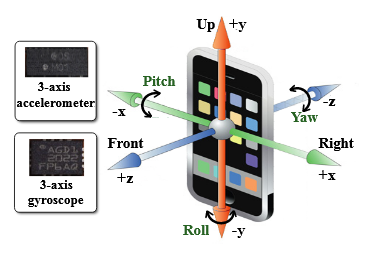
Figure 3.3: Linear & angular acceleration sensing using accelerometer and gyroscope.
A user’s specific driving behavior can be represented by his/her driving trips with regard to speed, acceleration, slope, and turning at individual time points. Specifically, speed is directly reported by GPS; slope of the road can be calculated from altitude reported by GPS; acceleration is reported by accelerometer but requires further compensation by gyroscope; and vehicle turning information is derived from gyroscope readings and calibrated by digital compass. As illustrated in figure 3.3, accelerometer and gyroscope can be used to sense linear and angular acceleration. By combining the readings of both sensors, detailed information about the device’s six-axis movement in space can be derived.

Figure 3.11: Categorization of (p)HEV operation modes under different driving scenarios.
First, we investigate the relationship between user driving behavior and (P)HEV operation. Modeling (P)HEV energy use is a difficult task. On one hand, users’ driving behaviors are diverse and vary by road and traffic conditions. On the other hand, under different conditions, a (P)HEV may be powered by either battery or fuel, or both, each of which is a complex process. To address these issues, we have identified five operation modes for the Toyota Prius control system, based on the operation animation displayed on dashboard. The modes are illustrated in figure 3.11.
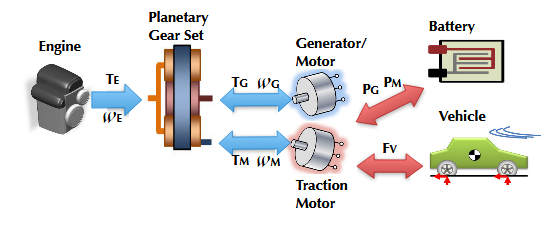
Figure 3.12: (P)HEV energy profile analysis. Engine and battery system work together to balance the power demand of the vehicle.
Based on the different operation modes, we develop an analytical (P)HEV model specifically for Toyota Prius in MATLAB. Prius adopts series-parallel structure in its drive-train, where the engine, generator/motor and traction motor are coupled together through the planetary gear set to provide the demanded traction power. The driving power requirement is distributed between the Motor and ICE depending on the different modes and user-specific driving behavior. This procedure is illustrated in figure 3.12.
ISCOPE: PERSONALIZED MULTI-MODALITY IMAGE MANAGEMENT AND SEARCH FOR MOBILE DEVICES
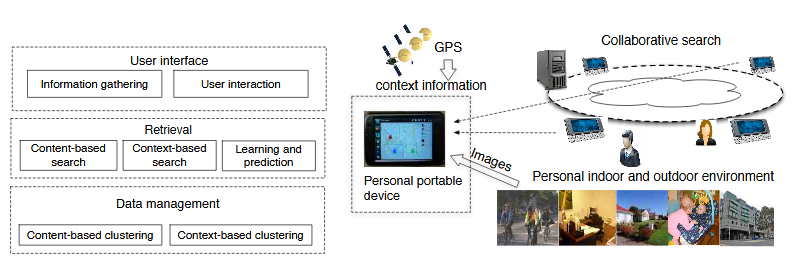
Figure 4.1: System architecture overview of iScope: Personalized multi-modality image search for mobile devices.
In this chapter, we describe iScope, a personal content management platform. iScope is a user-centric design targeting energy-constrained distributed mobile environments. It leverages both personal context information and efficient content search techniques, as well as online learning techniques, to deliver personalized, energy-efficient content search services. It provides a collaborative search environment, enabling distributed image search on mobile devices, thus facilitating information discovery and social interaction. We have implemented a prototype of iScope and conducted in-field experiments using Nokia N810 portable Internet tablet devices.
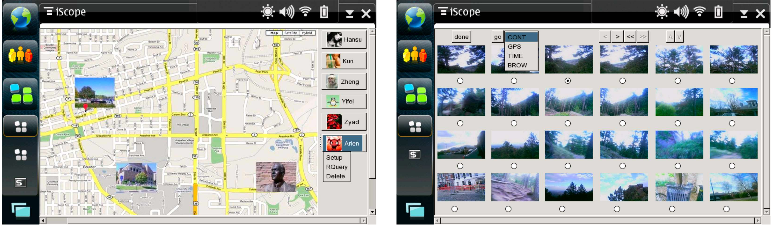
Figure 4.6: User interface running on Nokia N810. The figure on the left shows the start page, and the figure on the right shows search results. Last row in search results is based on adaptive prediction.
One of the main difficulties standing in the way of greater benefit from any intelligent search algorithm is difficulty of use. Most existing browsing-based user interfaces, although inefficient, are straightforward to use. iScope aims to make mobile image search accessible to large population of mobile system users spanning different age groups with different interests and technical backgrounds: an easy-to-use interface is essential.
We have designed a user interface that is accessible to people with no technical background. It supports queries via a straightforward search process. Figure 4.6 shows the prototype user interface implemented on a nokia n810 device.
MAQS: A PERSONALIZED MOBILE SENSING SYSTEM FOR INDOOR AIR QUALITY MONITORING
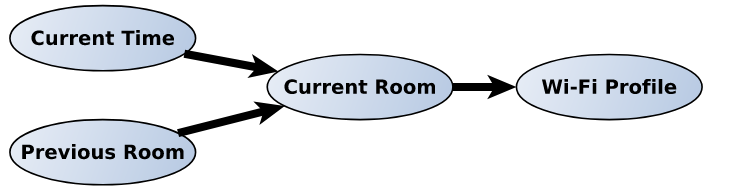
Figure 5.3: bayesian network for room localization
As shown in the experimental results, our n-gram augmented bayesian room localization model achieves high accuracy when the room has enough fingerprints (more than 50 or 100). However, when the number of fingerprints is low, the model accuracy is poorer and users tend to be misclassified into nearby rooms. To remove such spatial errors, we propose to incorporate temporal user mobility information. This is motivated by the following observations.
Based on these observations, a user’s current room can be predicted based on current time and previous room. As shown in figure 5.3, the bayesian network has three layers: current time and user’s previous room (first layer) indicate the user’s current room (second layer), and user’s current room determines the observed wi-fi rss fingerprint. we also define a set of values to represent some semantic concepts of time, including “day of week”, “morning”, “afternoon”, and “evening”.
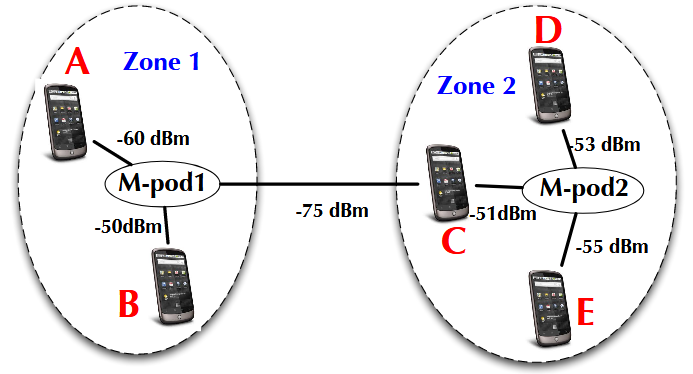
Figure 5.8: Zone-based collaborative sensing
In addition to IAQ data sharing by people in the same room, users may also be interested in rooms which they have not yet visited; building managers would like to know the IAQ in their buildings; and medical personnel may need the information to diagnose their patients. MAQS provides a permission control mechanism allowing users to specify the type, location, and time periods of data to be shared publicly. They can also define groups and share their IAQ data with other members in each group, e.g., their family members.
GAZELLE: WEARABLE SENSING AND ANALYSIS FOR FITNESS AND HEALTH
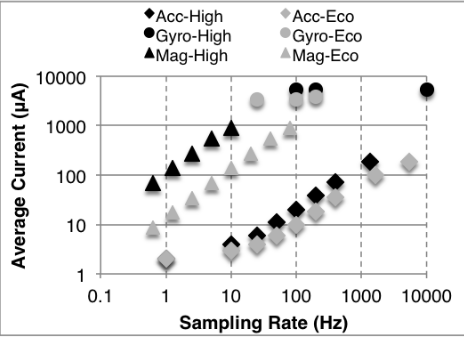
Figure 6.2: Average current by component across frequency and operational power modes.
Wearable devices sense mechanical and electrical analog signals generated by a user’s motion, physiology, or environment which are converted into digital signals for interpretation by a micro- processor. MEMS sensor ICs, especially MEMS IMUs, have been the chosen wearable data sensing solution, since they conveniently place together the sensing element, analog signal conditioning, and analog-to-digital (ADC) converter into a single miniaturized package. However, it can be observed from the current profiles in figure 6.2 that MEMS IMUs introduce the following key problems to achieving the targeted 1 year wearable device battery lifetime.
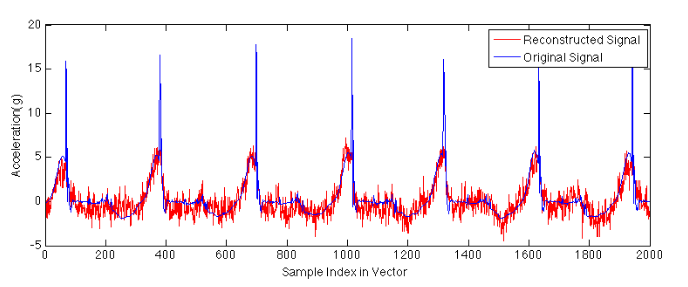
Figure 6.6: Signal reconstruction based on extracted feature
Figure 6.6 shows an example of single axis acceleration running signal and the coefficients of its discrete cosine transform (DCT). It can be seen that running acceleration signal is sparse (compressible) when represented by cosine basis. So compressive sensing technique [ x ] can be applied to reduce the amount of data needs to be stored and transferred through wireless communication. According to the theory of compressive sensing, the compressed signal.
CONCLUSION
Wearable computing systems are a quickly emerging personal computing platform. They consist of one or more wearable devices serving as sensing terminals, a mobile phone serving as a sensing and information sharing hub, and cloud infrastructure for intensive analysis work. These systems will eventually deliver personalized and intelligent service to the user.
This thesis primarily focuses on two aspects of power optimization for wearable computing systems. 1) methodological quantification of power efficiency challenge, and 2) systematic approaches to address it by leveraging context information in an application agnostic, yet practical manner. Power consumption breakdown analysis is done on both components and system level, and an adaptive sensing and communication framework is applied to different applications to verify the improvement of power efficiency. The proposed approach has been tested and used in a real world user study deployment. The methodology of this thesis can be readily applied to other forms of wearable computing platform.
This thesis makes the following contributions:
- Based on a comprehensive analysis of the power consumption in a wearable computing system, it is demonstrated that in wearable application, battery life time and good user experience is tightly coupled; improve one part and the other is naturally improved. On the other hand, power consumption is no longer dominated by computational workload. Rather, components for user interaction and data communication contribute equally to energy expenditure.
- It is shown that there is significant room for improvement in wearable computing system power efficiency. The standard battery life expectation for current wearable computers is measured in days. However, by leveraging the rich context information and unique characteristics of usage pattern of wearables, an adaptive sensing and communication framework is proposed, which makes it possible to prolong battery life of wearable computing system to be in the scale of months or even years.
Source: University of Colorado
Author: Kun Li
>> WiFi based IoT Projects for Engineering Students
>> Top IoT Projects using Matlab for B.E/B.Tech Students
>> 200+ IoT Led Projects for Final Year Students
>> IoT Projects in Medical Field for Engineering Students
>> 50+ Matlab projects for Digital Image Processing for Final Year Students
>> 200+ Matlab Projects based on Control System for Final Year Students
>> 80+ Matlab Projects based on Power Electronics for Final Year Students