ABSTRACT
In this thesis, we have designed and developed a motion tracking and visualization system using the latest motion tracking sensory technologies. It is one of the enabling technologies for our novel visual – inertial odometer and human anatomy based 3D Locating, Mapping and Navigation system for endoscopy and drug delivery capsules used inside GI tract.
In particular, we have: i) designed and completed a cloud – based sensory data collecting, processing and storage system to provide the reliable computing and storage platform; ii) explored different data processing methods to obtain improved – quality motion results from extremely noisy raw data, e.g., by using a low pass and high pass filter, and Kalman filters; iii) developed low – complexity algorithms to support real – time data analysis; and, iv) provided real – time 3 dimensional visualizations by a Unity 3D based visualizer.
In this thesis, we have also showcased the use of application processors, which are widely used in smart phones and tablets, to develop a potentially low – cost sensor system and networks with enhanced computing, storage and networking capabilities. Specifically, we have explored Android/ Android Wear, Google’s open source mobile OS’s, enabled smart devices, such as Sony Smartwatch 3, and their built – in sensory capabilities to build our sensory system.
The completeness and maturity of such a widely used mobile platform ensure a fast prototype design and development process, as well as significantly better reliability and usability. The reliability of our sensory system is further improved through the use of a database approach, such as transactions, for the data flow from sensors to mobile platform and eventually to the cloud. Thus, our prototype design provides a working model to collect sensor data from Android Wear, and then transfer and store them into the cloud for further processing and dissemination.
SENSOR SYSTEM AND MOTION CAPTURE DEVICES
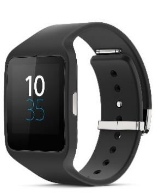
Figure 2.1 Sony Smartwatch 3 (SWR50).
Sony Smartwatch 3 Android Wear is a standalone smart device with built – in processors, storage and sensory capabilities. It also provides connectivity to Android Phone or Tablet (Android Handheld) devices with version Android 4.3 or later. It has maximum scratch resistance and durability, waterproof protection and a stainless – steel body. It also provides other features for Android Wear development purpose as illustrated in the following specifications in Table 2.1.
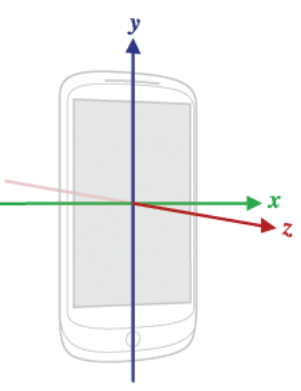
Figure 2.2 Nexus 7 Device Coordinate System.
- X axis is horizontal with a positive value on right and negative on left.
- Y axis is vertical with a positive value upwards and negative value downwards.
- Z axis is positive values in front of the screen.
Device coordinates do not change when the device is in portrait mode or landscape mode. Figure 2.2 displays the device coordinate system in Asus Nexus 7 Tablet.
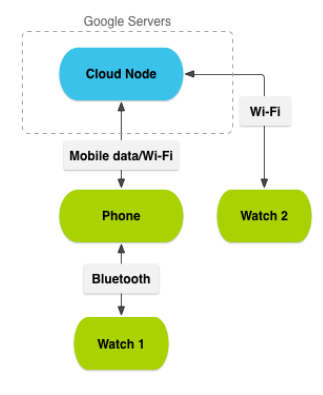
Figure 2.4 Interaction between Android Wear and Android Handheld devices.
Android Sony Smartwatch 3 provides power – efficient networking connectivity via 4.0 Bluetooth, Wi – Fi, GPS, NFC and USB. Figure 2.4 illustrates how Sony smartwatch 3 connects as an IoT (Internet of Things) device through an Android handheld to the Cloud in order to transfer and sync a high volume of sensor data, to receive notifications, to send – receive messages, etc.
PROTOTYPE OF A STAND – ALONE MOTION CAPTURE DEVICE USING AN ANDROID DEVICE
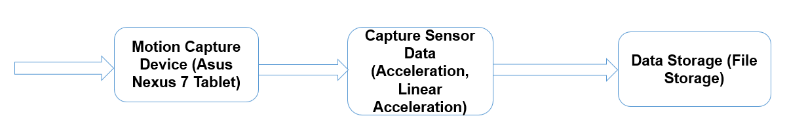
Figure 3.1 Workflow to collect sensor data from Asus Nexus 7 Tablet.
Figure 3.1 describes the workflow of our prototype of a stand – alone motion capture device that collects motion sensor data using an Android tablet.
In this work, we have designed a prototype which can specify sampling rates and particular sensor type to capture data of interest in device coordinate systems and store corresponding timestamps, three – dimensional sensor data into a Microsoft Excel (.csv) file. This file is then used for further data analytics. Our motivation behind this is to design a Kalman filter base sensor data filtering algorithm to filter tablet linear acceleration sensor data and evaluate velocity and position. Later, use that algorithm to filter watch sensor data.
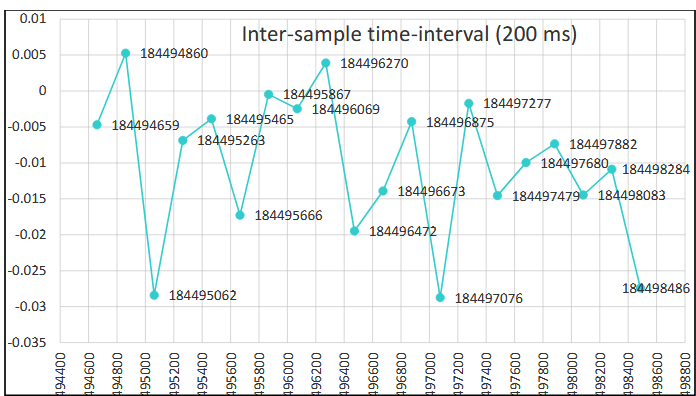
Figure 3.3 Timestamp vs linear acceleration sensor data (200 milliseconds sensor rate).
Figure 3.3 presents the timestamp and sensor data for the Y – axis for case (i). Timestamp is given in milliseconds and linear acceleration sensor data on the Y – axis is in m/s^2. The inter – sample time – interval is calculated by the timestamp difference between two successive sensor events.
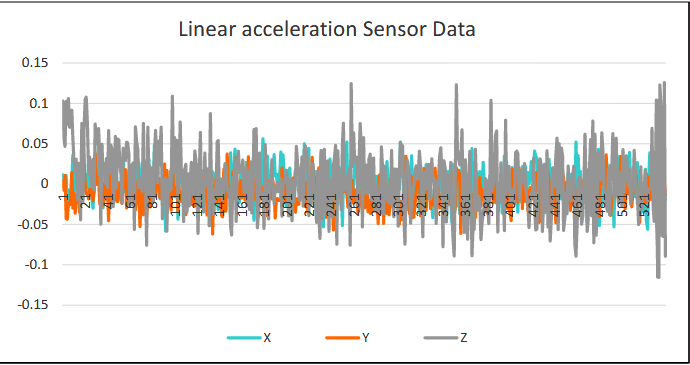
Figure 3.8 Linear acceleration sensor data around device coordinates.
Asus Nexus 7 linear acceleration sensor is similar to the Sony smartwatch 3 but the only difference is in Nexus 7 linear acceleration, the sensor hardware designed by Qualcomm. So, this sensor does not work as a secondary sensor which is exactly working as a raw sensor. Figure 3.8 indicates linear acceleration sensor data captured from Asus Nexus 7 when the device is stable on the table. So, the motion sensor data is closed to zero. Because of sensor errors, these data are not exactly zero.
SENSOR – WEB BASED CLOUD SOLUTION AND PROTOTYPE DESIGNS
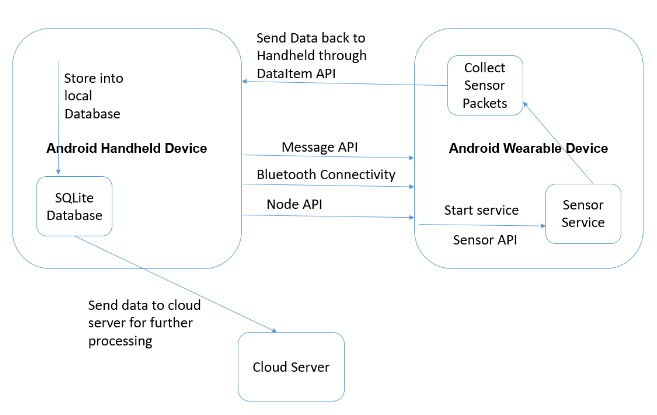
Figure 4.1 Describe flow of our sensor – web based system prototype.
Above, workflow describes the step – by – step work – flow of sending and synchronizing huge sensor data between Android handheld and Android Wear able device through Android Wearable APIs. It also provides mobile and cloud data connectivity to accommodate further sensor data storage and analytics.
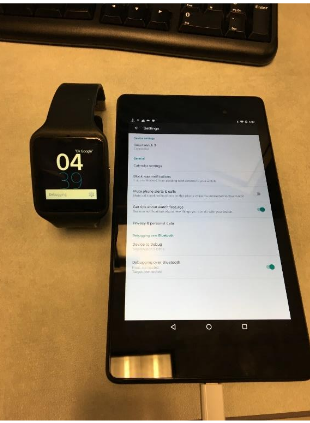
Figure 4.7 The Bluetooth connection between the two nodes.
As we discussed in the earlier chapter, Sony smartwatch 3 provides connectivity with other devices through Bluetooth 4.0. We use Android Studio IDE (Integrated development environment), Android Wear SDK (Software development kit) version 4.4 or later, and Android handheld SDK version 4.3 or later. Together, they provide us with the development environment and required libraries.
Figure 4.7 shows that a successful connection has been established between Asus Nexus 7 and Sony smartwatch 3 by pairing, and both devices are ready to debugging over Bluetooth. After pairing Android Wear able with a handheld, the next step is to establish debugging over Bluetooth. This is completed by enabling USB debugging on the Android handheld device, and enabling ADB debugging and Debug over Bluetooth on the Android Wearable.
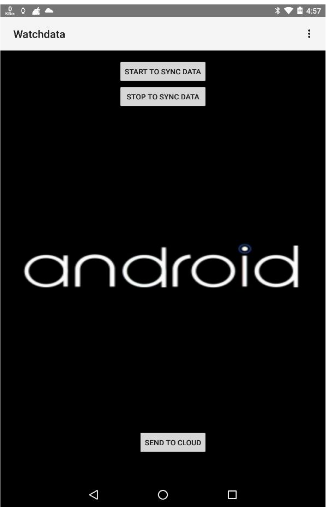
Figure 4.8 Android handheld application design.
In our prototype, as shown in the Fig.4.8 The START TO SYNC DATA button is tapped to send a message from android handheld application to Sony smartwatch 3 to start collecting data, while STOP TO SYNC DATA button is tapped to send message from android handheld application to Sony smartwatch 3 to stop collecting data. We have used Android Wear Node and Message APIs to implement this messaging function.
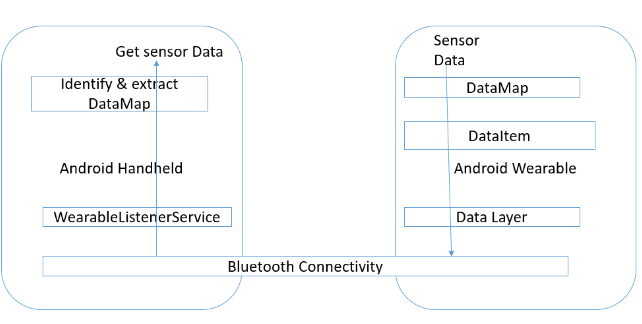
Figure 4.10 Syncing data from Android Wear to handheld through DataItem.
As illustrated in Fig. 4.10, extracted sensor data from Android Wear are first locally stored into DataMap, and then, in groups, sent to Android handheld in real – time. The number of samples being grouped together has to be carefully considered in order to limit the transfer delay for real – time applications. On the other hand, the receiver at the handheld will extract the data from DataMap and store it into the local database.
ESTIMATE ACCELERATION, VELOCITY AND POSITION THROUGH SENSOR DATA FILTERING TECHNIQUES
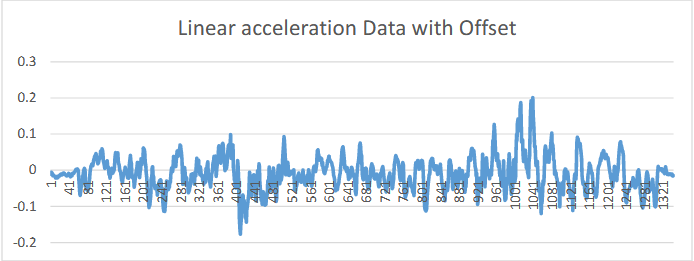
Figure 5.2 Linear acceleration Data with Offset/Bias Error.
Linear acceleration raw sensor data always has an offset inside that, as illustrated in Fig. 5.2. Clearly, sensor data x, y, z axes values are not exactly zero when at rest on a table, indicating constant offset in the readings.
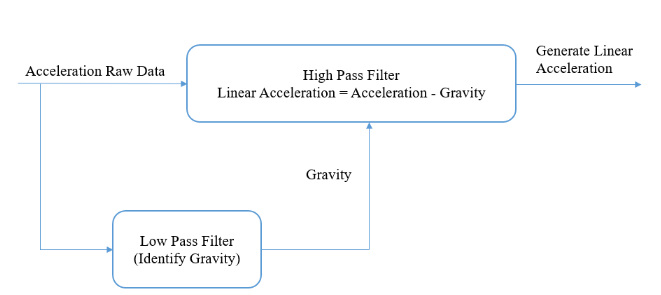
Figure 5.3 Block Diagram of Low – pass and High – pass Filtering.
In our Sony smartwatch 3 based sensor data collection prototype, acceleration sensor readings include the gravity. So, we have used low – pass/ high – pass filter to filter out the gravity effects from raw acceleration sensor data. Specifically, low pass filter is used to identify the force of gravity and then high pass filter is used to subtract that gravity data from raw acceleration sensor data. Here we are producing synthetic linear acceleration sensor using raw acceleration sensor data and the filtering technique.
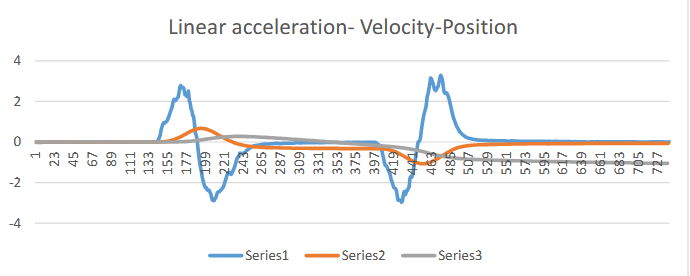
Figure 5. 14 Series1: Linear acceleration, Series2: Velocity, Series3: Position.
In summary, Figure 5.14 presents all together the final analysis results for Acceleration, Velocity, and Position Data.
The velocity and, especially, the position results start show the effect of cumulative errors from the integration processes as the subject advances in time and space, indicating the need for additional velocity and /or position data in order to correct the cumulative errors. These side information could be obtained, e.g., through a digital map of the area, either well – established ahead of deployment, or, on the fly by Simultaneous Locating and Mapping based on visual and distance sensors, such as Google – Tango technologies.
CONCLUSION
In this section, we have concluded overall work from all the above chapters as well as describes a lot of new opportunities which can be done in the future using this research work.
In this thesis, we have concluded the motion tracking and visualization capabilities using the latest motion sensory technologies such as Android Wear Sony smartwatch 3 and google Asus Nexus 7 devices. Android Wear able and handheld devices are low in price and give nice features for development. We analyzed Android Sony smartwatch 3 sensor capabilities, processing capabilities and network capabilities. Also, we have designed sensor web – based cloud solution prototype to collect accelerometer sensor data real – time with higher sampling rate, accuracy, and store huge dataset on a cloud for further processing. We have designed a Stand – alone Motion Capture prototype for Google Nexus 7 device to capture and analyze accelerometer, linear acceleration sensor data with higher sampling r ate and store into file for further processing.
We have monitored raw noisy sensor data errors and developed low complexity algorithms to support real – time data analysis. Explored different data processing methods to obtain improved – quality motion results from extremely noisy raw data, e.g., by using low pass and high pass filter, and the Kalman filters. We believe this work helps tremendously in Healthcare to identify the causes of lower back pain and assist with the corresponding 80 therapy process. Also, an other potential application of this research, is to enable automatic locating and mapping capability inside the GI tract system in order to provide the high – precision navigation capabilities for endoscopy and drug delivery capsules used in GI medicine. We expect that these proposed new technologies will provide improved workflow, accuracy, and efficiency in sports, fitness, and healthcare fields.
Source: Wright State University
Author: Dhruvkumar Navinchandra Patel
>> IoT based Android Application Projects for Engineering Students
>> IoT based Real-Time Projects for B.E/B.Tech Students
>> 200+ IoT Led Projects for Final Year Students
>> IoT based Networking Projects for Engineering Students
>> IoT Software Projects for Final Year Students