ABSTRACT
This project enhances the user’s music listening experience by not only adding but also synchronizing visuals to the music. The project digitally analyzes music being played back and controls LEDs to give an audio-visual experience. This report describes the materials and knowledge used to create a proof of concept for a wireless and portable music reactive LED lighting system.
REQUIREMENTS
Overview
The project needs to have an LED strip react to audio in real-time and over Wi-Fi. The ESP8266 communicates with the LED strip via SPI with only the SDO (data) and SCK (clock) lines. There is a logic level shifter between the ESP8266 and the LED strip because the former is 3.3V device and the latter is a 5V device. The ESP8266 and the PC running the Processing app must be on the same network. The audio signal processing must be done by the Processing app using the Minim library and the Fast Fourier Transform (FFT) within it.
The project works with any audio but really only makes sense with music. Because it reacts to audio in general, there is no limit to the number of songs it supports. There are four different visualization modes and some have the ability to be customized in terms of speed and color. The project also requires the use of Blynk, a platform on iOS and Android that is used to control devices, in this case the ESP8266, over the Internet. The system needs to run until it is turned off by the user. The system cannot be tethered to a PC or a power socket and needs to be convenient to place around a house.
BACKGROUND
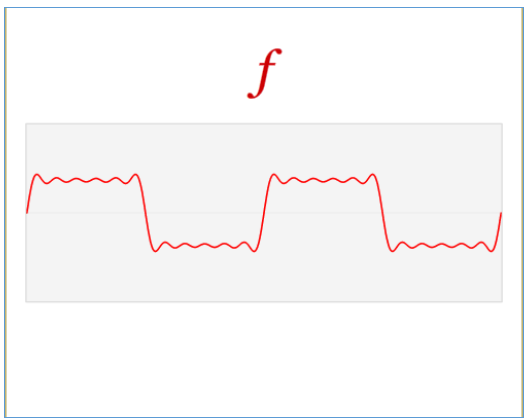
Figure 1: Signal in Time Domain (X-time, Y-amplitude).
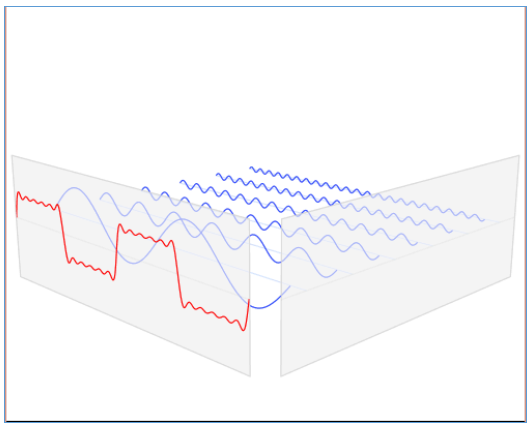
Figure 2: Signal in Time (X-time, Y- amplitude) and Frequency Domain (X-frequency, Y-amplitude) – Overlapped.
The specific usage of the DFT in this project includes a buffer size of 1024 bytes and a sample rate of 44,100 Hz. The resulting DFT object has logarithmically calculated averages because that is how humans hear sound. Below, as a series, Figures 1 through 4 show the relationship between the time domain and the frequency domain of a signal. First in Figure, 1 an arbitrary signal is shown in the time domain in red. Then in Figure 2, the same signal is shown as a composition of different signals at different frequencies in blue. When these signals of different frequencies are added together, they result in the original signal shown in Figure 1.
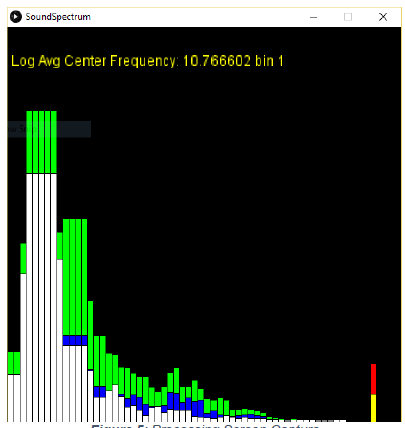
Figure 5: Processing Screen Capture.
Figure 5 below shows the energy levels of the sound spectrum for the song being played. Each vertical bar represents a frequency band. The frequency range spans 0 to 22050 Hz from left to right. The height of the vertical bar represents the average sound energy at that frequency band.
Green = local statistical maximum = set mean + 3 * standard deviation of set
Blue = local statistical mean = set mean
White = instant average sound energy.
DESIGN
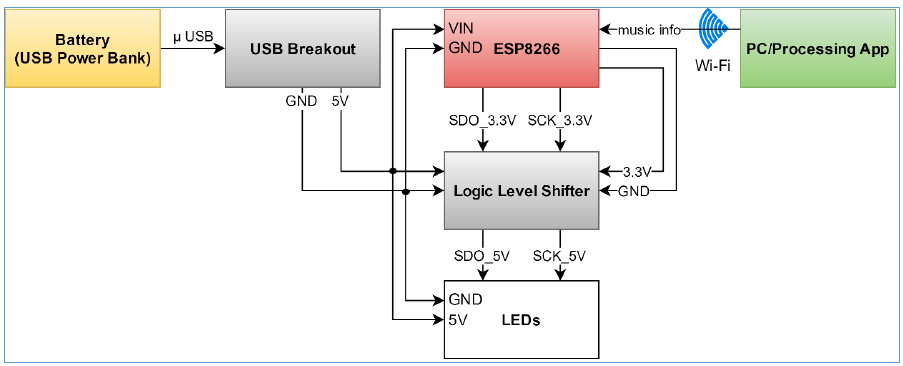
Figure 6: Hardware Block Diagram.
Figure 6 below is the hardware block diagram and it shows the direction data and power flows throughout the system. Music is played back on a remote PC running the music analysis software. The music analysis software streams beat information over Wi-Fi to the ESP8266 board. The board controls the visualization of the LEDs with the beat information. The battery powers the ESP8266 board and the LEDs. It also provides the 5V reference voltage for the logic level shifter while the ESP8266 provides the 3.3V reference voltage.
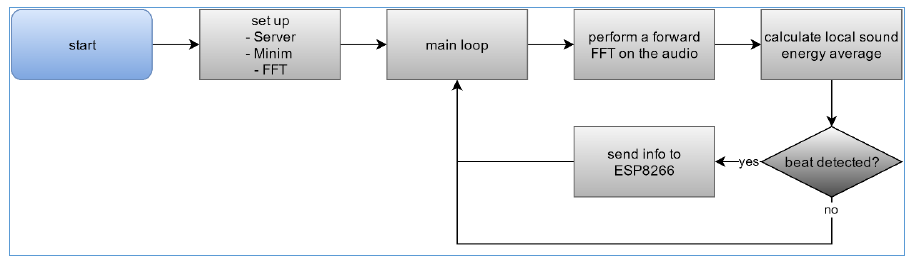
Figure 11: Software Flowchart.
Figure 11 below is the software flowchart for the Processing program. Like Arduino, an initial set up function initializes the server and audio analysis tools before the endless main loop. Every iteration through the main loop has an FFT applied to the current 1024-byte sample of audio. A local sound energy average is calculated and if a beat is detected the ESP8266 is notified. If there is no beat the flow goes back to applying an FFT on the next sample of audio and the process repeats.
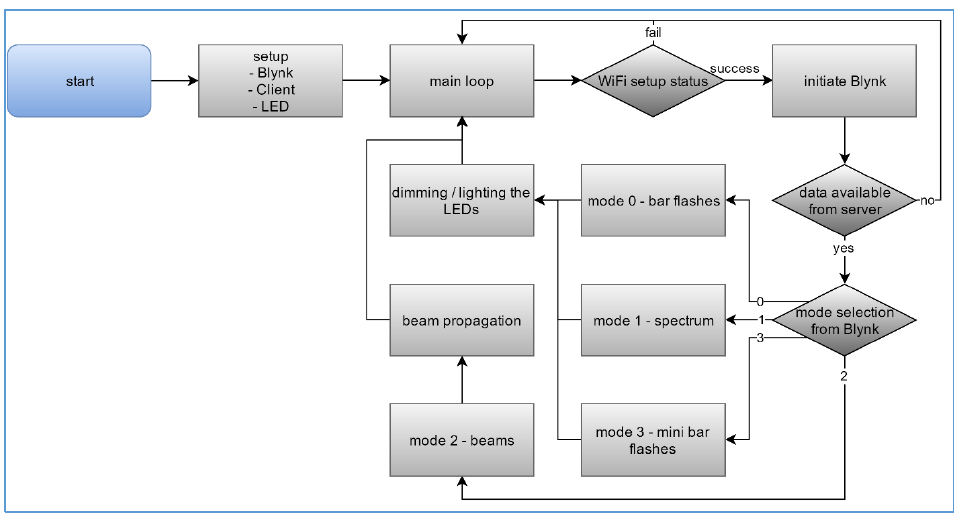
Figure 13: Firmware Flowchart.
Figure 12 below is the firmware flowchart for the ESP8266. An initial setup function is run only once and it initializes the Blynk app connection, the client, and the LED strip. Inside the main loop, the first thing it does is check whether the Wi-Fi client successfully established a connection with the server. If not, the program does nothing. If successful, the program checks if data is available from the server. If not, the loop ends and it polls until data becomes available. Once data is available, beats are visualized according to the currently selected Mode.
TESTING
To test if the ESP8266 was functional, there is an example provided by the Internet that simply blinks the on board LED on and off. The test consisted of uploading the code onto the board and visually inspecting for the blinking LED. It was successful. To test if the LED strip was functional, there is an example provided by the Internet that simply propagated a beam through the LED strip. The test consisted of uploading the code onto the board and visually inspecting for the light beam going across the strip. It was successful.
CONCLUSION AND FUTURE WORK
The design works rather well. According to the specifications and requirements that were set out, it only failed to meet one and subjectively meets two others. Because the goal of the project is to entertain, which makes the goal inherently subjective, it ultimately depends on the end user whether they like the results or not. Personally, the results are satisfactory given the nine weeks of time that was spent developing the project.
However, it should be noted that many improvements can still be made. The current system requires two separate parts working together: the client (board) and the server (PC). It would be ideal for the two parts to be in one comprehensive system. It depends on the specific application, but many use cases could benefit from the project being just one comprehensive system. The client part is also not currently one hundred percent reliable because of its indefinite runtime as discussed earlier. One caveat of this two part system is that it requires a shared network. However, nowadays wireless networks are widely available and even if one cannot be found, a typical smartphone can provide a personal hotspot as well.
Although not currently in use, there is some logic and ideas for a future implementation dealing with the average spectrum sound energy and the max spectrum sound energy. This would add more modes of visualization. The project could also benefit from having its own mobile app instead of using Blynk. If the system becomes one comprehensive system, it could be taken on-the-go to music festivals or friends’ houses without the need to install the signal processing program on a PC. The beat detection algorithm is currently rather basic too. Another improvement would be creating an algorithm that could adapt to different kinds of songs.
Source: Cal Poly
Authors: Peter Chu
>> More Wireless Projects using Arduino for Engineering Students
>> More Wireless Energy Projects for Final Year Students
>> More Wireless Hacking Projects for Wi-fi Enthusiasts for Final Year Students