ABSTRACT
In above-rated wind speeds, the goal of a wind turbine blade pitch controller is to regulate rotor speed while minimizing structural loads and pitch actuation. This controller is typically feedback-only, relying on a generator speed measurement, and sometimes strain gauges and accelerometers. A preview measurement of the incoming wind speed (from a turbine-mounted lidar, for example) allows the addition of feedforward control, which enables improved performance compared to feedback-only control. The performance improvement depends both on the amount of preview time available in the wind speed measurement as well as the coherence (correlation as a function of frequency) between the wind measurement and the wind that is experienced by the turbine.
This thesis shows how to design an optimal collective-pitch controller that takes both preview time and measurement coherence into account. Simulation results show significantly reduced pitch actuation, improved generator speed regulation, and reduced structural loads compared to several different baseline cases. In addition, linear-model-based results show how the benefit of preview depends on the preview time and measurement coherence.
Effective lidar-based control also requires knowledge of the expected arrival time of the measured wind. Arrival time is the time it takes for the wind to travel from the measurement focus location to the turbine rotor. Arrival time is often assumed to be equal to the distance traveled divided by the average wind speed. This thesis, using field test data, studies deviations from this assumption.
Control implementation across the full range of above-rated wind speeds can be achieved through gain scheduling. The effect of gain scheduling implementation on effective feedforward and feedback gains is not straightforward. This thesis provides a detailed explanation of the effective gains resulting from two different gain-scheduling implementations. It includes an analysis of a simplified version of a nonlinear gain scheduling feedback loop as well as verification through simulation with a full nonlinear controller and turbine model.
Additional topics covered in this thesis include a model-inverse-based analysis of the conditions under which lidar is beneficial, a breakdown of the maximum useful amount of preview time by its different uses, and a comparison of two lidar-based individual pitch controllers.
MODEL-INVERSE-BASED ANALYSIS
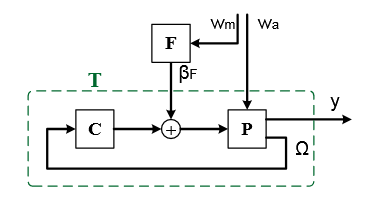
Figure 2.1: Block diagram showing linearized models of the wind turbine P, the feedback controller C, and the feedforward controller F.
Figure 2.1: Block diagram showing linearized models of the wind turbine P, the feedback controller C, and the feedforward controller F. The labeled signals are the differences from the linearization operating point: measured wind speed wm, actual wind speed wa, feedforward pitch command βF, generator speed Ω, and some output of interest y.
For example, y may be equal to Ω, to a blade bending moment, or to a tower bending moment. Each of these signals, excluding Ω, may be a vector of three values when considering individual pitch control, or they may each be a single value when considering collective pitch control. T is the closed-loop model containing the feedback controller and the turbine.
OPTIMAL BLADE PITCH CONTROL WITH REALISTIC PREVIEW WIND MEASUREMENTS
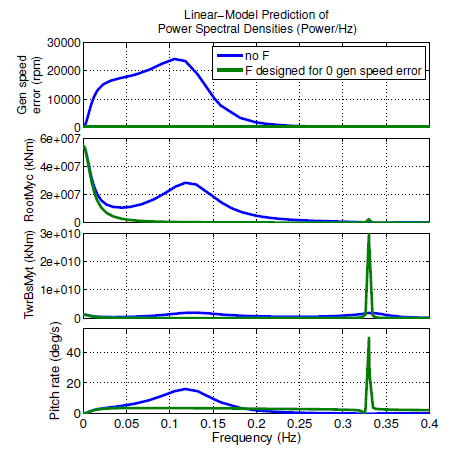
Figure 3.1: Linear-model predictions of power spectral densities of generator speed error, blade root out-of-plane moment.
Figure 3.1: Linear-model predictions of power spectral densities of generator speed error, blade root out-of-plane moment (RootMyc), tower base fore-aft moment (TwrBsMyt), and pitch rate for the NREL 5-MW turbine, with all 16 degrees of freedom, linearized at 18 m/s, assuming a rotoraveraged Kaimal wind spectrum with class A turbulence. Blue represents feedback-only control (no F), and green represents feedback control augmented with an ideal feedforward control (F) designed to perfectly eliminate generator speed error.
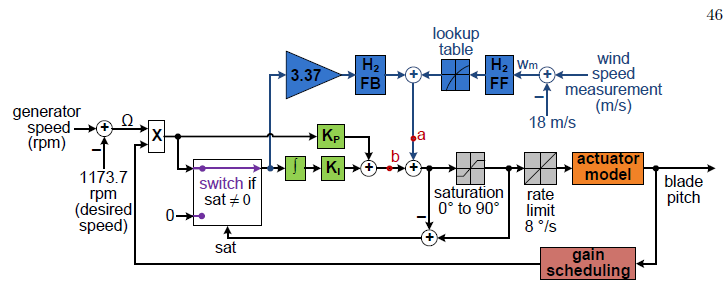
Figure 3.13: Block diagram of control implementation in simulation.
Figure 3.13: Block diagram of control implementation in simulation. The baseline gain-scheduled proportional-integral feedback (PI FB) controller is represented by everything not colored blue. Blue blocks and lines represent the H2 control additions, so that the overall block diagram represents the combined H2 feedforward/feedback controller.
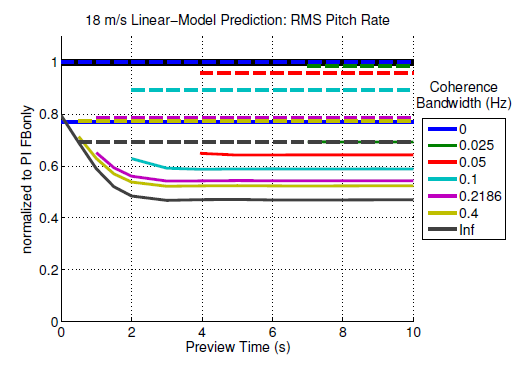
Figure 3.22: 18 m/s linear-model expectations of RMS pitch rate.
Figure 3.22: 18 m/s linear-model expectations of RMS pitch rate, normalized so that the expected RMS pitch rate of baseline PI feedback-only equals 1, for a range of preview times and coherence bandwidths, for lowpass filter feedforward (LPF FF) control in dashed lines and H2 feedforward/feedback control with medium pitch penalty (H2 FF/FB, medPP) in solid lines.
PREVIEW TIME ANALYSIS
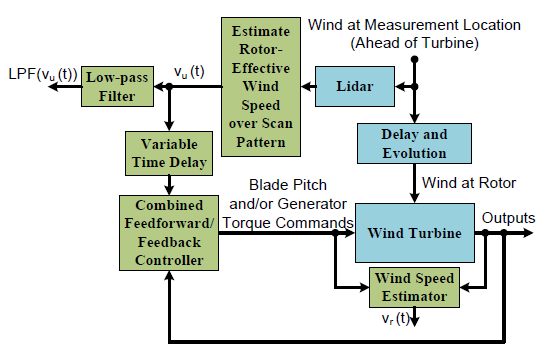
Figure 4.6: Block diagram of wind turbine control using a turbine-mounted lidar under real-world conditions with varying preview time.
Figure 4.6: Block diagram of wind turbine control using a turbine-mounted lidar under real-world conditions with varying preview time. Physical devices and processes are shown in blue, and control system components are shown in green. It is likely that a different low-pass filter (sometimes called a prefilter) is also contained in the feedforward part of the Combined Feedforward/Feedback Controller.
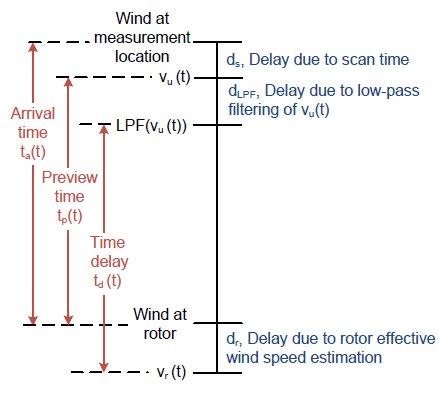
Figure 4.7: Visual representation of possible introduced time delays and the naming conventions.
Figure 4.7: Visual representation of possible introduced time delays and the naming conventions used in Section 4.2. Delays in blue are constant in time, and red indicates functions of time that vary with the evolving wind field. In Section 4.2, dLPF = dr = 0, and ds = 0:67s. We use the word \timing” to refer in general to all three signals ta(t), tp(t), and td(t).
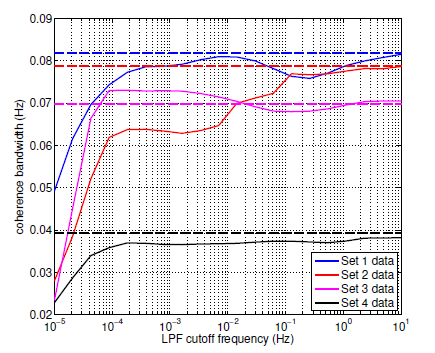
Figure 4.14: Coherence bandwidth between turbine estimate vr(t) and lidar measurement vu(t).
Figure 4.14: Coherence bandwidth between turbine estimate vr(t) and lidar measurement vu(t) with variable time delay using TLPFx-axis(vu(t)) (the wind speed v used is the lidar measurement filtered with a first-order low-pass filter with cutoff frequency shown on the x-axis). The dashed lines represent no filtering (infinite cutoff frequency).
COMPARISON OF TWO LIDAR-BASED INDEPENDENT PITCH CONTROL DESIGNS
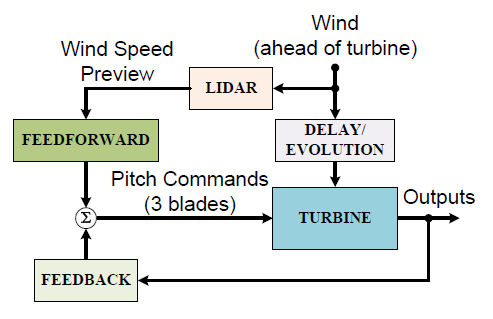
Figure 5.1: Feedforward control added to feedback control.
This chapter discusses two different methods for implementing lidar-based individual pitch control that were previously designed under separate studies. Both of the two control designs in this chapter are feedforward controllers that are intended to be added on to a standard feedback controller as shown in Figure 5.1. Many design features differ between the two methods including lidar scan patterns, and feedback and feedforward control strategies.
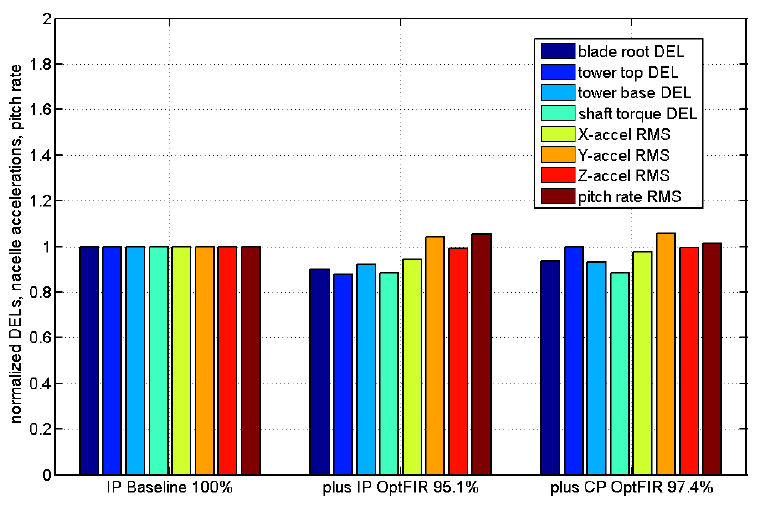
Figure 5.3: Turbine loads using individual pitch baseline feedback control alone (method A ), and with added feedforward controller A (method AAA).
Figure 5.3: Turbine loads using individual pitch baseline feedback control alone (method A ), and with added feedforward controller A (method AAA), in individual pitch and collective pitch versions. Percents displayed are the average of the eight bars. Feedforward controller A reduces overall loads by 4.9% in the individual pitch version. The results are averages from FAST simulations across 155 wind les representing AR1 through AR5.
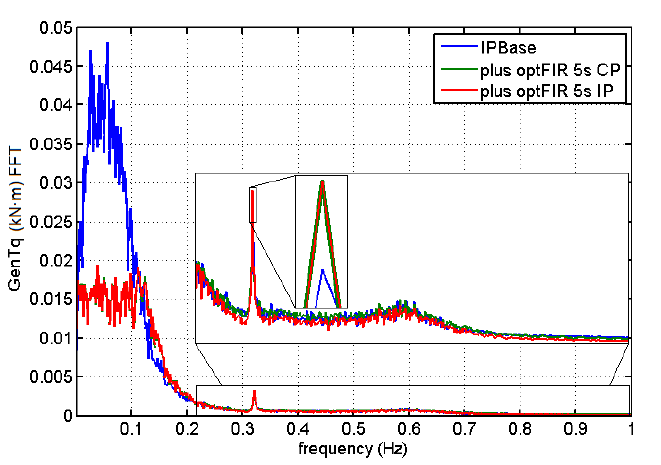
Figure 5.14: Generator torque as a function of frequency.
Figure 5.14: Generator torque as a function of frequency. Plot is also representative of relative magnitudes of generator speed as a function of frequency because generator torque is inversely proportional to generator speed. Average FFT magnitude over AR1 s12 through AR1 s27.
GENERAL CONCLUSIONS AND FUTURE RECOMMENDATIONS
It has recently become feasible to use lidar to capture preview measurements of the wind approaching a wind turbine, and this has opened up a whole new realm of possibilities for preview control. One way that we can use these measurements is in a Region 3 blade pitch control system. These preview measurements allow improved compensation for wind disturbances, resulting in improved Region 3 blade pitch control performance. The major design challenges involved in incorporating preview measurements into a blade pitch controller include imperfect correlation between the preview measurement and the wind that arrives at the turbine rotor, a varying and imperfectly-known preview time, and nonlinear implementation considerations.
The main conclusions of this thesis are as follows:
- A linear, single-output, model-inverse-based analysis of disturbance feedforward control shows that if a control design assumes perfect measurement coherence, then the lidar measurements allow improved performance at a given frequency only when the magnitude of the measurement error is less than the magnitude of the wind disturbance.
- An H2 optimal control design process that accounts for the both the measurement coherence and available preview time is explained. Simulation results show significantly reduced pitch actuation, improved generator speed regulation, and reduced structural loads, compared to several different baseline cases. One of these cases is a simple feedforward controller (LPF FF) that has been field tested with good results. Another of these baseline cases is a feedback-only controller that was created using the same optimal control design process, only without lidar measurements available. This comparison allows a true evaluation of the benefit of lidar.
- Linear-model-based predictions quantify how the benefit of lidar changes with measurement coherence and preview time.
- When generator speed regulation is the only control goal, at least one second of preview time is useful for pitch control, with the majority used to cancel the delay introduced by lowpass filtering, which is required because of imperfect measurement coherence. Useful preview time increases with decreasing coherence bandwidth. When an optimal controller penalizes pitch rate in addition to generator speed error, five or more seconds of preview may be useful.
- An analysis of available preview time from CART2 field experiment data shows evidence that the induction zone is responsible for the average preview time being greater than the amount predicted by Taylor’s frozen turbulence hypothesis. The field data analysis also shows that, in order to maximize measurement coherence, the amount of variable time delay of preview measurements should be based on an unfiltered wind speed signal. However, filtering the wind speed signal does increase the minimum preview time available, so the choice of amount of filtering should be made considering the tradeoff between measurement coherence and minimum preview time.
Source: University of Colorado
Authors: Fiona Dunne